介绍 perf 工具的使用方式、局限性和问题。
计数 vs 采样 vs 追踪 #
-
计数 counting:统计特定事件的次数,如
perf top/stat,不产生perf.data文件。 -
采样 profing: 使用
perf record按照特定频率或 CPU 事件(如 instrument 或 cycle)来记录 CPU 寄存器值,产生perf.data文件,然后在用户空间使用perf report或perf script进行分析; -
追踪 tracing:调用特定内核或用户函数(kprobe、uprobe、tracepoint、syscall)或返回时进行记录(event tracing),获得参数、返回值、延迟、执行频率等信息;
使用 perf record 对整个系统或整个进程进行采样的 CPU 和磁盘开销较大,对进程性能也有影响。所以,最好使用 perf probe/trace 来对特
定函数进行追踪记录。
查看 perf 构建参数 #
# perf version --build-options
perf version 4.19.91-007.ali4000.alios7.x86_64.debug
                 dwarf: [ on  ]  # HAVE_DWARF_SUPPORT
    dwarf_getlocations: [ on  ]  # HAVE_DWARF_GETLOCATIONS_SUPPORT
                 glibc: [ on  ]  # HAVE_GLIBC_SUPPORT
                  gtk2: [ OFF ]  # HAVE_GTK2_SUPPORT
         syscall_table: [ on  ]  # HAVE_SYSCALL_TABLE_SUPPORT
                libbfd: [ on  ]  # HAVE_LIBBFD_SUPPORT
                libelf: [ on  ]  # HAVE_LIBELF_SUPPORT
               libnuma: [ on  ]  # HAVE_LIBNUMA_SUPPORT
numa_num_possible_cpus: [ on  ]  # HAVE_LIBNUMA_SUPPORT
               libperl: [ on  ]  # HAVE_LIBPERL_SUPPORT
             libpython: [ on  ]  # HAVE_LIBPYTHON_SUPPORT
              libslang: [ on  ]  # HAVE_SLANG_SUPPORT
             libcrypto: [ on  ]  # HAVE_LIBCRYPTO_SUPPORT
             libunwind: [ OFF ]  # HAVE_LIBUNWIND_SUPPORT
    libdw-dwarf-unwind: [ on  ]  # HAVE_DWARF_SUPPORT
                  zlib: [ on  ]  # HAVE_ZLIB_SUPPORT
                  lzma: [ OFF ]  # HAVE_LZMA_SUPPORT
             get_cpuid: [ on  ]  # HAVE_AUXTRACE_SUPPORT
                   bpf: [ on  ]  # HAVE_LIBBPF_SUPPORT
常用 perf 命令 #
perf list: 查看事件 events;perf stat:事件 event 计数;perf record:将事件 event 写入文件;perf report:查看文件中事件;perf script:使用脚本处理事件;
perf list 查看支持的事件 #
perf list 显示支持的事件类型:
- hw: 硬件,CPU performance monitoring counters;
- sw:软件,基于 Kernel 的计数,如 CPU migrations, minor faults, major faults 等;
- cache
- tracepoint:追踪,基于 kernel 定义的静态追踪点;
- pmu:CPU PMU
- sdt
- event_glob: 事件名称 glob 匹配
- usdt:用户程序定义的静态追踪点;
- 动态追踪:如 kprobes、uprobes;
- 计时采样:按照特定频率产生中断事件,记录 CPU 执行情况;
[root@devops-110 ~]# perf list -h

 Usage: perf list [<options>] [hw|sw|cache|tracepoint|pmu|sdt|event_glob]

    -d, --desc            Print extra event descriptions. --no-desc to not print.
    -v, --long-desc       Print longer event descriptions.
        --debug           Enable debugging output
        --details         Print information on the perf event names and expressions used internally by events.

[root@devops-110 ~]# perf list |wc -l
1172

[root@devops-110 ~]# perf list |& head
  alignment-faults                                   [Software event]
  bpf-output                                         [Software event]
  context-switches OR cs                             [Software event]
  cpu-clock                                          [Software event]
  cpu-migrations OR migrations                       [Software event]
  dummy                                              [Software event]
  emulation-faults                                   [Software event]
  major-faults                                       [Software event]
  minor-faults                                       [Software event]
  page-faults OR faults                              [Software event]

[root@devops-110 ~]# perf list 'sched:*'

[root@devops-110 ~]# perf list software # 只显示 software 事件类型

List of pre-defined events (to be used in -e):

  alignment-faults                                   [Software event]
  bpf-output                                         [Software event]
  context-switches OR cs                             [Software event]
  cpu-clock                                          [Software event]
  cpu-migrations OR migrations                       [Software event]
  dummy                                              [Software event]
  emulation-faults                                   [Software event]
  major-faults                                       [Software event]
  minor-faults                                       [Software event]
  page-faults OR faults                              [Software event]
  task-clock                                         [Software event]

[root@devops-110 ~]# perf list tracepoint |head
  block:block_bio_backmerge                          [Tracepoint event]
  block:block_bio_bounce                             [Tracepoint event]
  block:block_bio_complete                           [Tracepoint event]
  block:block_bio_frontmerge                         [Tracepoint event]
  block:block_bio_queue                              [Tracepoint event]
  block:block_bio_remap                              [Tracepoint event]
  block:block_dirty_buffer                           [Tracepoint event]
  block:block_getrq                                  [Tracepoint event]
  block:block_plug                                   [Tracepoint event]
  block:block_rq_abort                               [Tracepoint event]
[root@devops-110 ~]#
后续进行采样或追踪时,可以使用 -e event_type 来指定事件类型。
[root@devops-110 ~]# perf top -e net:netif_receive_skb
perf stat 事件计数 #
perf stat 用于统计整个系统或特定命令、进程的 CPU performance counter 统计值,或指定事件类型(-e
event)的执行次数,可以为后续采样频率提供参考。
-
-e event_glob:来指定采集指定事件类型的统计数据,如各系统调用的执行次数:
-
-a:采样所有 CPU 核;
采集整个系统:
[root@devops-110 ~]# perf stat -a sleep 5

 Performance counter stats for 'system wide':

         20,002.77 msec cpu-clock                 #    4.000 CPUs utilized
            16,887      context-switches          #    0.844 K/sec
               157      cpu-migrations            #    0.008 K/sec
               181      page-faults               #    0.009 K/sec
   <not supported>      cycles
   <not supported>      instructions
   <not supported>      branches
   <not supported>      branch-misses

       5.000764361 seconds time elapsed
采集执行特定命令:
[root@devops-110 ~]# perf stat ls

 Performance counter stats for 'ls':

              0.69 msec task-clock                #    0.734 CPUs utilized
                 0      context-switches          #    0.000 K/sec
                 0      cpu-migrations            #    0.000 K/sec
               265      page-faults               #    0.386 M/sec
   <not supported>      cycles
   <not supported>      instructions
   <not supported>      branches
   <not supported>      branch-misses

       0.000934209 seconds time elapsed

       0.000000000 seconds user
       0.000978000 seconds sys
采集特性进程:指定 -p PID。
[root@devops-110 ~]# perf stat -e 'syscalls:sys_enter_*' -a sleep 5  |& grep -E -v '^[[:blank:]]+0'

 Performance counter stats for 'system wide':

                 1      syscalls:sys_enter_sendto
                 2      syscalls:sys_enter_epoll_ctl
             4,981      syscalls:sys_enter_epoll_wait
                 9      syscalls:sys_enter_select
                 5      syscalls:sys_enter_ppoll
                30      syscalls:sys_enter_getdents
             1,226      syscalls:sys_enter_ioctl
...
             3,220      syscalls:sys_enter_nanosleep
                 7      syscalls:sys_enter_times
                11      syscalls:sys_enter_rt_sigprocmask
                 7      syscalls:sys_enter_rt_sigaction
                 1      syscalls:sys_enter_exit_group
                 1      syscalls:sys_enter_wait4
                12      syscalls:sys_enter_mmap

       5.006476383 seconds time elapsed

# Various basic CPU statistics, system wide, for 10 seconds:
$ sudo perf stat -e cycles,instructions,cache-references,cache-misses,bus-cycles -a sleep 10

# Count syscalls per-second system-wide:
$ sudo perf stat -e raw_syscalls:sys_enter -I 1000 -a

# Count system calls by type for the specified PID, until Ctrl-C:
$ sudo perf stat -e 'syscalls:sys_enter_*' -p PID

# Count scheduler events for the specified PID, for 10 seconds:
$ sudo perf stat -e 'sched:*' -p PID sleep 10
perf top CPU 热点统计 #
和 linux top 命令类似,perf top 实时采样和显示 CPU 执行的函数,适用于分析系统整体的 CPU 负载和热点情况。
perf top 默认采集所有 CPU,使用 -C 来指定 CPU 核。
- 按 q 键退出;
- 按 h 显示帮助;
# Trace system calls by process, showing a summary refreshing every 2 seconds:
perf top -e raw_syscalls:sys_enter -ns comm
perf record 采样 #
perf record 采样是按照一定频率来记录内核及应用程序的执行状态以及调用栈,它底层使用内核提供的 perf_event_output 系统调用来记录各种事件。
选项说明:
- -a:采样所有 CPU 核;
- -C:采样指定的 CPU 核;
- -p PID:采样指定进程,否则是所有进程。如果要展示特定进程的火焰图,则需要使用改选项;
- -F 99:采样频率,perf 使用该频率暂停程序,获得它的调用栈等信息;
- -g:表示记录函数调用栈:
-
对于内函数调用,内核不使用 DWARF,而是使用 FP 或 ORC (4.14 及以后内核),
perf record会自动选择; -
对于用户函数,默认使用
--call-graph=fp,即使用 frame pointer 来进行 stack unwinding,其它可选值包括dwarf和lbr。
对于用户函数,如果 ELF 没有使用 FP (frame pointer),则需要指定 --call-graph=dwarf,它使用 ELF 的
.eh_frame 或 debuginfo 文件中的 .debug_frame 数据进行 stack unwinding。
- 各发行版一般在单独的 XX-debuginfo 或 XX-dbgsym 包中包含 DWARF 调试信息,对于不使用 FP 的二进制,需要先安装这些包。
gcc 默认生成 .eh_frame 而且不能被 strip,所以通常指定 --call-grap=dwarf 比 fp 更通用。
对于 --call-graph dwarf,perf 是将函数调用信息从内核空间拷贝并保存到 perf.data 文件中,然后使用 libdw 库从 DWARF、FP
中解析出调用栈详情,所以性能低一些。
除了 stack unwinding 外,perf record 还使用符号表(.symtab、.dynsym)和 DWARF 符号表
(.debug_xx)来对程序运行时符号地址进行解析,需要采样的进程二进制以及依赖的共享库(如 libc6-dbg,zlib1g-dbg)包含它们。
这两类符号表不是程序运行所必须的,同时为了减少二进制大小,各发行版一般把它们从 ELF 中 strip(dynsym 不能被 strip),然后保存到单独的 debuginfo 包中。所以为了 perf、bpfrace 正常工作,需要安装对应的 XX-debuginfo 或 XX-dbgsym 包,用于提供程 序 ELF 文件 对应的符号表和 DWARF 调试符号表:
- 使用 file 或 objedump 或 readelf 命令查看 ELF 是否包含 debuginfo 和符号表;
- 如果不能符号解析,则后续生成的火焰图会有大量的 unkonwn block;
- 内核符号表使用的是 /proc/kallsyms 或者 vmlinux ELF 文件;
如果未指定 -F 频率,则按照 CPU 指令级别进行记录,可以用来评估系统整体的 CPU 繁忙情况,但是开销和性能影响较大。
$ sudo perf record -a -g sleep 5
$ sudo perf report
$ sudo perf report --stdio --comm fvUnisocket --percent-limit 0.5
如果指定了 -F 频率,则按照对应的频率进行采样(sampling):
- -F 指定的频率越高,对 CPU、磁盘 IO 的压力越大。
执行 perf record 时一般需要提高系统最大采集频率(-1 表示不限制):$ echo {rate} > /proc/sys/kernel/perf_event_max_sample_rate
$ sudo perf record -F 99 -g --call-graph=dwarf -p 35775 -- sleep 10
[ perf record: Woken up 584 times to write data ]
Warning:
2 out of order events recorded.
[ perf record: Captured and wrote 172.619 MB perf.data (1128041 samples) ]

$ du -sh perf.data
173M    perf.data
采样的数据保存在 perf.data 文件中,后续通过 perf report/script 来读取和分析。
bpftrace 也支持 profile 采样,底层也是用的 perf 数据源(perf_event_output 系统调用):
bpftrace -e 'profile:hz:99 {@[kstack]=count();}'
Attaching 1 probe...
^C@[
native_safe_halt+14
__cpuidle_text_start+28
do_idle+497
cpu_startup_entry+111
start_secondary+420
secondary_startup_64+164
]: 112
@[
native_safe_halt+14
__cpuidle_text_start+28
do_idle+497
cpu_startup_entry+111
start_kernel+1292
secondary_startup_64+164
]: 227
perf record 指定事件类型 #
使用 -e event_glob 指定事件指定过滤参数(可以通过 perf probe -V 来显示可用参数),而非所有事件:
# Trace all block completions, of size at least 100 Kbytes, until Ctrl-C:
perf record -e block:block_rq_complete --filter 'nr_sector > 200'

# Trace all block completions, synchronous writes only, until Ctrl-C:
perf record -e block:block_rq_complete --filter 'rwbs == "WS"'

# Trace all block completions, all types of writes, until Ctrl-C:
perf record -e block:block_rq_complete --filter 'rwbs ~ "*W*"'

# Trace all ext4 calls, and write to a non-ext4 location, until Ctrl-C:
perf record -e 'ext4:*' -o /tmp/perf.data -a

# Sample stacks to 2 levels deep, and, context switch stacks to 5 levels (needs 4.8):
perf record -F99 -e cpu-clock/max-stack=2/ -e cs/max-stack=5/ -a -g
PMU(Performance Monitoring Unit)是 CPU 的一组专用寄存器,当执行每个 CPU 指令时递增,当 PMU 计数器溢出时 CPU 触发一个特 殊中断,然后被 kernel 处理,kernel 进而获得当前正在执行的线程状态数据。
PMU 相关的事件类型:task-clock,context-Switches,cpu-migrations,page-faults,cycles,instructions,branches,branch-misses。
$ sudo perf record -e instructions -c 1000000 -p 1234
记录执行指定命令的事件:
$ sudo perf record -e cycles  find /
[ perf record: Woken up 1 times to write data ]
[ perf record: Captured and wrote 0.091 MB perf.data (2195 samples) ]
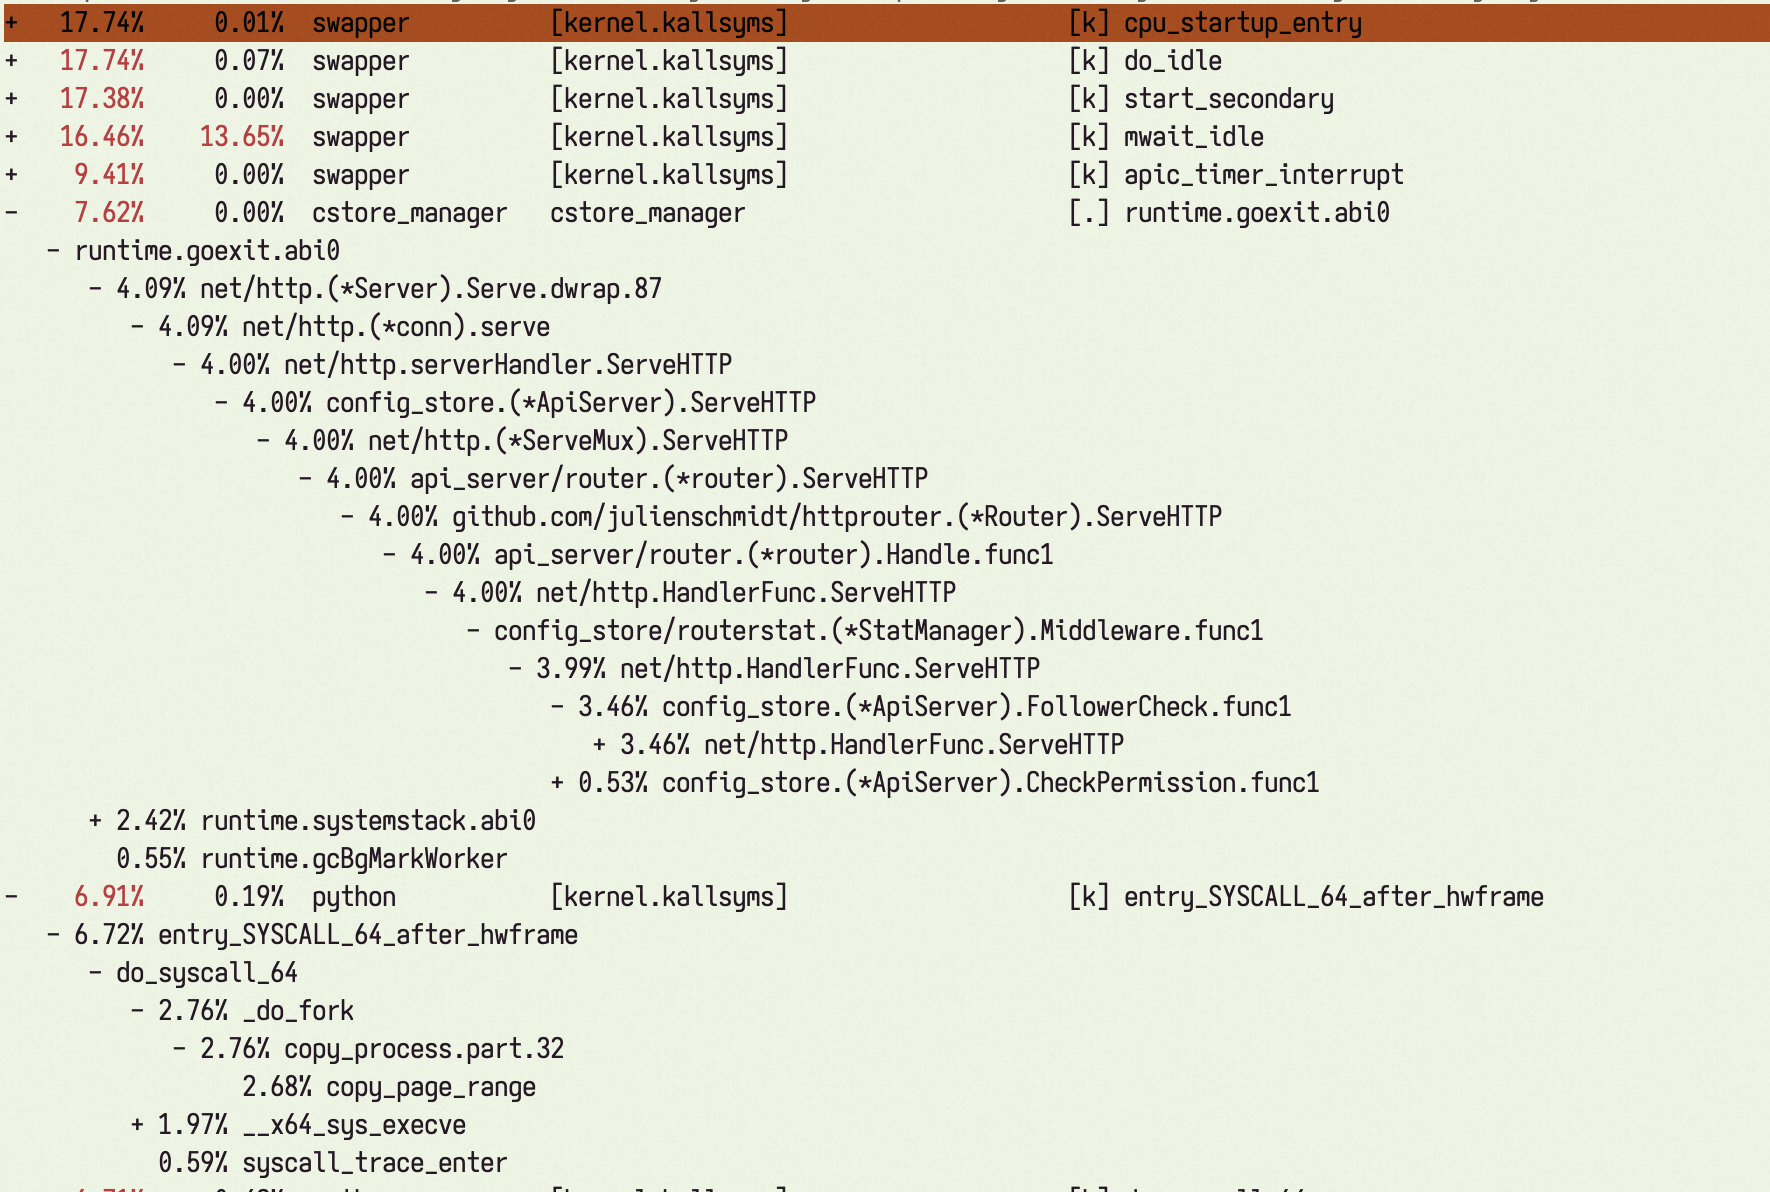
perf report 分析采样结果 #
分析 perf.data 文件中哪些函数占用的 CPU 最多:
[k]表示内核函数;[.]表示用户函数;
$ perf report
Samples: 24K of event 'cycles', Event count (approx.): 4868947877
  Children      Self  Command   Shared Object        Symbol
+   17.08%     0.23%  swapper   [kernel.kallsyms]    [k] do_idle
+    5.38%     5.38%  swapper   [kernel.kallsyms]    [k] intel_idle
+    4.21%     0.02%  kubelet   [kernel.kallsyms]    [k] entry_SYSCALL_64_after_hwframe
+    4.08%     0.00%  kubelet   kubelet              [.] k8s.io/kubernetes/vendor/github.com/google/...
+    4.06%     0.00%  dockerd   dockerd              [.] net/http.(*conn).serve
+    3.96%     0.00%  dockerd   dockerd              [.] net/http.serverHandler.ServeHTTP
...
示例:
# perf record -e block:block_rq_issue -ag
^C

# ls -l perf.data
-rw------- 1 root root 3458162 Jan 26 03:03 perf.data

# perf report
[...]
# Samples: 2K of event 'block:block_rq_issue'
# Event count (approx.): 2216
#
# Overhead       Command      Shared Object                Symbol
# ........  ............  .................  ....................
#
    32.13%            dd  [kernel.kallsyms]  [k] blk_peek_request
                      |
                      --- blk_peek_request
                          virtblk_request
                          __blk_run_queue
                         |
                         |--98.31%-- queue_unplugged
                         |          blk_flush_plug_list
                         |          |
                         |          |--91.00%-- blk_queue_bio
                         |          |          generic_make_request
                         |          |          submit_bio
                         |          |          ext4_io_submit
                         |          |          |
                         |          |          |--58.71%-- ext4_bio_write_page
                         |          |          |          mpage_da_submit_io
                         |          |          |          mpage_da_map_and_submit
                         |          |          |          write_cache_pages_da
                         |          |          |          ext4_da_writepages
                         |          |          |          do_writepages
                         |          |          |          __filemap_fdatawrite_range
                         |          |          |          filemap_flush
                         |          |          |          ext4_alloc_da_blocks
                         |          |          |          ext4_release_file
                         |          |          |          __fput
                         |          |          |          ____fput
                         |          |          |          task_work_run
                         |          |          |          do_notify_resume
                         |          |          |          int_signal
                         |          |          |          close
                         |          |          |          0x0
                         |          |          |
                         |          |           --41.29%-- mpage_da_submit_io
[...]
这是一个 TUI 交互式界面,可以选中具体函数展开查看详情。
添加 --stdio 参数后直接在 stdout 显示结果,使用 --sort <column name> 指定排序方式:sudo perf report -n --sort comm,symbol --stdio
demangle #
perf report 默认支持和开启 C++/Rust 等函数名称 demangle:
--demangle: Demangle symbol names to human readable form. It’s enabled by default, disable with –no-demangle.--demangle-kernel: Demangle kernel symbol names to human readable form (for C++ kernels).
当 perf report 显示的函数名是 _Z*, _ZN*, _ZL* 等,说明该 perf 工具在编译时不支持 demangling,
- 编译时需要先安装 libbfd 库;
- 查看内核 tools/perf/Makefile.config 中的配置参数。
- https://stackoverflow.com/questions/34234354/perf-shows-mangled-function-names
—- Rust 函数名 mangling 示例 —-
Rust 函数名 mangling 后的格式: https://rust-lang.github.io/rfcs/2603-rust-symbol-name-mangling-v0.html
  _RNvNtCs1234_7mycrate3foo3bar
  <>^^^^^<----><------><--><-->
   ||||||   |      |     |   |
   ||||||   |      |     |   +--- "bar" identifier
   ||||||   |      |     +------- "foo" identifier
   ||||||   |      +------------- "mycrate" identifier
   ||||||   +-------------------- disambiguator for "mycrate"
   |||||+------------------------ start-tag for "mycrate"
   ||||+------------------------- namespace tag for "foo"
   |||+-------------------------- start-tag for "foo"
   ||+--------------------------- namespace tag for "bar"
   |+---------------------------- start-tag for "bar"
   +----------------------------- common Rust symbol prefix
可以使用 rustfilt 工具进行 demangle:
# rlib 是 Rust 编译生成的静态库
❯ nm target/debug/deps/libmy_demo-2c918bd8bd6b1c77.rlib

lib.rmeta:
target/debug/deps/libmy_demo-2c918bd8bd6b1c77.rlib:lib.rmeta: no symbols

my_demo-2c918bd8bd6b1c77.6fg39t3e0vwd88d9zbr7ioa1j.1y07x8w.rcgu.o:
                 U __ZN3std2io5stdio6_print17h068a7c8fe03701f4E
                 U __ZN4core3fmt2rt38_$LT$impl$u20$core..fmt..Arguments$GT$9new_const17ha3888ccef9b469abE
0000000000000000 T __ZN7my_demo5hello17h4b85738f5c82ab0fE
0000000000000034 s l_anon.b27ae52ee22afa02c25801ca93529f61.0
0000000000000040 s l_anon.b27ae52ee22afa02c25801ca93529f61.1
0000000000000000 t ltmp0
0000000000000034 s ltmp1
0000000000000040 s ltmp2
00000000000000ca s ltmp3
0000000000000298 s ltmp4
00000000000002b8 s ltmp5

my_demo-2c918bd8bd6b1c77.aq8mw1jgqf27i1b4p5k0bzldz.1y07x8w.rcgu.o:
0000000000000000 T __ZN4core3fmt2rt38_$LT$impl$u20$core..fmt..Arguments$GT$9new_const17ha3888ccef9b469abE
0000000000000048 s l_anon.d56747e2a7f22d5a93d4373863465371.0
0000000000000000 t ltmp0
0000000000000048 s ltmp1
0000000000000635 s ltmp2
0000000000001020 s ltmp3
0000000000001040 s ltmp4

# 使用 rustfilt 对 Rust 符号进行 demangle
❯ nm target/debug/deps/libmy_demo-2c918bd8bd6b1c77.rlib|rustfilt
target/debug/deps/libmy_demo-2c918bd8bd6b1c77.rlib:lib.rmeta: no symbols

lib.rmeta:

my_demo-2c918bd8bd6b1c77.6fg39t3e0vwd88d9zbr7ioa1j.1y07x8w.rcgu.o:
                 U _std::io::stdio::_print
                 U _core::fmt::rt::<impl core::fmt::Arguments>::new_const
0000000000000000 T _my_demo::hello
0000000000000034 s l_anon.b27ae52ee22afa02c25801ca93529f61.0
0000000000000040 s l_anon.b27ae52ee22afa02c25801ca93529f61.1
0000000000000000 t ltmp0
0000000000000034 s ltmp1
0000000000000040 s ltmp2
00000000000000ca s ltmp3
0000000000000298 s ltmp4
00000000000002b8 s ltmp5

my_demo-2c918bd8bd6b1c77.aq8mw1jgqf27i1b4p5k0bzldz.1y07x8w.rcgu.o:
0000000000000000 T _core::fmt::rt::<impl core::fmt::Arguments>::new_const
0000000000000048 s l_anon.d56747e2a7f22d5a93d4373863465371.0
0000000000000000 t ltmp0
0000000000000048 s ltmp1
0000000000000635 s ltmp2
0000000000001020 s ltmp3
0000000000001040 s ltmp4
也可以使用 nm --demangle 来对 lib 中的 rust 符号进行 demangle:
❯ nm --demangle target/debug/deps/libmy_demo-2c918bd8bd6b1c77.rlib
由于 rustc 默认会对导出符号名称进行 mangle,所以为了让 C/C 程序能正确链接符号,在 Rust 代码中需要对导出的符号使用 #[no_mangle]
perf.data 符号补全 #
如果生成的 perf.data 文件没有符号解析(如使用 release 构建时 binary 消除了 debuginfo 和符号表),则可以使用 perf 的 buildid-cache 和 inject 命令来从有符号表的 binary 来解析 perf.data 中的符号:
# Add the symbols to perf database
pref buildid-cache -v -a /path/to/my/newbinary  # newbinary 有符号表

# Resolve the symbols from the db
perf inject -i perf.data -o perf_with_symbols.data # 使用 db 中的符号表来解析 perf.data 中的符号, 结果写入新的 data 文件

# Install flamegraph
cargo install cargo-flamegraph

# Render the flamegraph
flamegraph --perfdata perf_with_symbols.data
参考: https://zed.dev/docs/development/linux#later
perf script 打印调用栈 #
按照时间顺序打印 perf.data 中各命令的函数调用栈:
isc-socket 15964 [003] 1912865.267505:     699832 cycles:ppp:
        ffffffffa0422fb2 _copy_from_user+0x2 ([kernel.kallsyms])
        ffffffffaFailed to open /tmp/perf-38107.map, continuing without symbols
02efbbe __x64_sys_epoll_ctl+0x4e ([kernel.kallsyms])
        ffffffffa00042e5 do_syscall_64+0x55 ([kernel.kallsyms])
        ffffffffa0a00088 entry_SYSCALL_64_after_hwframe+0x44 ([kernel.kallsyms])
            7f460786349a epoll_ctl+0xa (/usr/lib64/libc-2.17.so)

swapper     0 [005] 1912865.267508:      20833 cycles:ppp:
        ffffffffa0067b76 native_write_msr+0x6 ([kernel.kallsyms])
        ffffffffa000c987 __intel_pmu_enable_all.constprop.26+0x47 ([kernel.kallsyms])
        ffffffffa06e9492 net_rx_action+0x292 ([kernel.kallsyms])
        ffffffffa0c00108 __softirqentry_text_start+0x108 ([kernel.kallsyms])
        ffffffffa009f594 irq_exit+0xf4 ([kernel.kallsyms])
        ffffffffa0a01cb2 do_IRQ+0x52 ([kernel.kallsyms])
        ffffffffa0a009cf ret_from_intr+0x0 ([kernel.kallsyms])
            7f67d9be12e7 vfprintf+0x3df7 (/usr/lib64/libc-2.17.so)
            7f67d9c0cfa9 _IO_vsnprintf+0x79 (/usr/lib64/libc-2.17.so)
                546f4db8 [unknown] (/tmp/perf-38107.map)

sqlonline_worke 38771 [006] 1912865.267542:          1 cycles:ppp:
        ffffffffa0067b76 native_write_msr+0x6 ([kernel.kallsyms])
        ffffffffa000c987 __intel_pmu_enable_all.constprop.26+0x47 ([kernel.kallsyms])
        ffffffffa01d27d3 event_function+0x83 ([kernel.kallsyms])
        ffffffffa01d3e69 remote_function+0x39 ([kernel.kallsyms])
        ffffffffa0139f50 flush_smp_call_function_queue+0x70 ([kernel.kallsyms])
        ffffffffa0a023b4 smp_call_function_single_interrupt+0x34 ([kernel.kallsyms])
        ffffffffa0a01b5f call_function_single_interrupt+0xf ([kernel.kallsyms])
        ffffffffc0362a76 ipt_do_table+0x2a6 ([kernel.kallsyms])
        ffffffffa073abbd nf_hook_slow+0x3d ([kernel.kallsyms])
        ffffffffa07471c3 ip_rcv+0xa3 ([kernel.kallsyms])
        ffffffffa06e8b00 __netif_receive_skb_one_core+0x50 ([kernel.kallsyms])
        ffffffffa06e7d02 netif_receive_skb_internal+0x42 ([kernel.kallsyms])
        ffffffffa06e9cf5 napi_gro_receive+0xb5 ([kernel.kallsyms])
        ffffffffc051da6b ixgbe_clean_rx_irq+0x49b ([kernel.kallsyms])
        ffffffffc051ef1b ixgbe_poll+0x2ab ([kernel.kallsyms])
        ffffffffa06e9492 net_rx_action+0x292 ([kernel.kallsyms])
        ffffffffa0c00108 __softirqentry_text_start+0x108 ([kernel.kallsyms])
        ffffffffa009f594 irq_exit+0xf4 ([kernel.kallsyms])
        ffffffffa0a01cb2 do_IRQ+0x52 ([kernel.kallsyms])
        ffffffffa0a009cf ret_from_intr+0x0 ([kernel.kallsyms])
            7f67d9be12e7 vfprintf+0x3df7 (/usr/lib64/libc-2.17.so)
            7f67d9c0cfa9 _IO_vsnprintf+0x79 (/usr/lib64/libc-2.17.so)
                546f4db8 [unknown] (/tmp/perf-38107.map)
perf script -c bash:只显示 bash 命令的函数调用栈。
Off-CPU Profiling #
Off-CPU Profiling - hotspot+perf #
见后文。
Off-CPU Profiling - eBPF #
Linux 4.6 开始支持 eBPF 的分析: https://www.brendangregg.com/blog/2016-01-20/ebpf-offcpu-flame-graph.html
- 对应的工具:https://github.com/iovisor/bcc/blob/master/tools/offcputime.py
详细参考:Off-CPU Flame Graphs
# /usr/share/bcc/tools/offcputime -df -p `pgrep -nx mysqld` 30 > out.stacks
[...copy out.stacks to your local system if desired...]
# git clone https://github.com/brendangregg/FlameGraph
# cd FlameGraph
# ./flamegraph.pl --color=io --title="Off-CPU Time Flame Graph" --countname=us < out.stacks > out.svg
老的基于 perf 的方式, 性能问题突出:Linux perf_events Off-CPU Time Flame Graph
# https://www.reddit.com/r/rust/comments/1cuvn4i/offcpu_profiling_a_rust_application/

sudo TAILCALL_LOG_LEVEL=error perf record -e cpu-clock,context-switches -g --output=perf.data --
./target/release/tailcall start ci-benchmark/nginx-benchmark.graphql

sudo perf script > out.perf

git clone https://github.com/brendangregg/FlameGraph.git
chmod +x FlameGraph/*.pl
cd /path/to/FlameGraph/cloned/repo
./stackcollapse-perf.pl path/to/out.perf > out.folded
./flamegraph.pl out.folded > flamegraph.svg
perf annotate 显示事件的源码和反汇编 #
sudo perf annotate --stdio -v
perf probe 跟踪函数调用栈 #
perf probe 用于对内核或用户程序进行 dynamic probe(trace),即 kprobe、tracepoint 和 uprobe。
示例函数:
# cat test.c
#
#include <stdio.h>
#include <unistd.h>

void func_d() {
                int msec=1;
                printf("%s","Hello world from D\n");
                usleep(10000*msec);
}
void func_c() {
                printf("%s","Hello from C\n");
                func_d();
}
void func_b() {
                printf("%s","Hello from B\n");
        func_c();
}
void func_a() {
                printf("%s","Hello from A\n");
                func_b();
}

int main() {
        func_a();
}
编译:
- 未开启优化,故 ELF 使用 FP;
- -g 表示生成 DWARF 格式的 .debug_xx 调试符号表;
- 编译器默认在 ELF 中生成符号表(.symtab 和 .dynsym) 和 .eh_frame;
# gcc test.c -g -o test
符号表、.eh_frame 和 .debug_xx 调试符号表是 perf probe 所必须的信息。如果 strip 了符号表、调试符号表,则 perf probe 将不能为函数添加 probe。
用户函数调用栈跟踪(uprobe):
# perf probe -x ./hello func_d
Added new event:
  probe_hello:func_d   (on func_d in /root/hello)

You can now use it in all perf tools, such as:

        perf record -e probe_hello:func_d -aR sleep 1

# perf record -e probe_hello:func_d -aR -g ./hello  # -g 默认使用 FP,也可以指定 -g --call-graph=dwarf
Hello from A
Hello from B
Hello from C
Hello world from D
[ perf record: Woken up 1 times to write data ]
[ perf record: Captured and wrote 0.162 MB perf.data (1 samples) ]

# perf script
hello 14239 [002]  5516.587824: probe_hello:func_d: (561112f12169)
            561112f12169 func_d+0x0 (/root/hello)
            561112f121e3 func_b+0x21 (/root/hello)
            561112f12207 func_a+0x21 (/root/hello)
            561112f1221c main+0x12 (/root/hello)
            7fe3e67e1d90 __libc_start_call_main+0x80 (/usr/lib/x86_64-linux-gnu/libc.so.6)
内核函数跟踪(kprobe、tracepoint、syscall):
# 查看内核可以动态 probe 的函数:
# perf probe -F |grep ^block |head
block_ce_count_show
block_class
block_commit_write
block_depr
block_devnode
block_group_cache_tree_search
block_group_err
block_invalidatepage
block_ioctl
block_is_partially_uptodate

# 查看用户程序可以动态 probe 的函数:
# perf probe -F -x ./hello |head
completed.0
data_start
deregister_tm_clones
frame_dummy
func_a
func_b
func_c
func_d
main
register_tm_clones
参考:
perf probe -V 显示函数参数 #
对于内核函数,需要通过 –vmlinux 参数来指定包含内核 .debug_xx 调试符号表的 vmlinux 文件:
- vmlinux 一般是 kernel-debuginfo 包提供的,需要先安装。
# readelf -S  /usr/lib/debug/lib/modules/4.19.91-007.ali4000.alios7.x86_64/vmlinux |grep -E 'debug|symtab|eh_'
  [11] __ksymtab         PROGBITS         ffffffff8215e8b0  0135e8b0
  [12] .rela__ksymtab    RELA             0000000000000000  0f4cb330
  [13] __ksymtab_gpl     PROGBITS         ffffffff82167f88  01367f88
  [14] .rela__ksymtab_gp RELA             0000000000000000  0f503c40
  [19] __ksymtab_strings PROGBITS         ffffffff82179a48  01379a48
  [61] .debug_aranges    PROGBITS         0000000000000000  01c76030
  [62] .rela.debug_arang RELA             0000000000000000  10097c28
  [63] .debug_info       PROGBITS         0000000000000000  01c9b9d0
  [64] .rela.debug_info  RELA             0000000000000000  100c36f8
  [65] .debug_abbrev     PROGBITS         0000000000000000  0c330c02
  [66] .debug_line       PROGBITS         0000000000000000  0c6a64cb
  [67] .rela.debug_line  RELA             0000000000000000  1f785c90
  [68] .debug_frame      PROGBITS         0000000000000000  0d05c6c0
  [69] .rela.debug_frame RELA             0000000000000000  1f79a3c0
  [70] .debug_str        PROGBITS         0000000000000000  0d27d7a0
  [71] .debug_loc        PROGBITS         0000000000000000  0d53a983
  [72] .rela.debug_loc   RELA             0000000000000000  1f980c30
  [73] .debug_ranges     PROGBITS         0000000000000000  0e03c570
  [74] .rela.debug_range RELA             0000000000000000  2085ff90
  [77] .symtab           SYMTAB           0000000000000000  0e975500

# ls -l /usr/lib/debug/lib/modules/4.19.91-007.ali4000.alios7.x86_64/vdso/
total 212
-r--r--r-- 1 root root  93452 Apr  8  2020 vdso32.so.debug
-r--r--r-- 1 root root 122824 Apr  8  2020 vdso64.so.debug

# perf probe -V tcp_sendmsg
Failed to find the path for kernel: Invalid ELF file
  Error: Failed to show vars.

# perf probe  --vmlinux /usr/lib/debug/lib/modules/4.19.91-007.ali4000.alios7.x86_64/vmlinux -V tcp_sendmsg
Available variables at tcp_sendmsg
        @<tcp_sendmsg+0>
                int     ret
                size_t  size
                struct msghdr*  msg
                struct sock*    sk

# Show available variables for the kernel tcp_sendmsg() function, plus external vars (needs debuginfo):
perf probe -V tcp_sendmsg --externs

# Show available line probes for tcp_sendmsg() (needs debuginfo):
perf probe -L tcp_sendmsg

# Show available variables for tcp_sendmsg() at line number 81 (needs debuginfo):
perf probe -V tcp_sendmsg:81

# Add a tracepoint for tcp_sendmsg(), with three entry argument registers (platform specific):
perf probe 'tcp_sendmsg %ax %dx %cx'

# Add a tracepoint for tcp_sendmsg(), with an alias ("bytes") for the %cx register (platform specific):
perf probe 'tcp_sendmsg bytes=%cx'

# Trace previously created probe when the bytes (alias) variable is greater than 100:
perf record -e probe:tcp_sendmsg --filter 'bytes > 100'
对于用户函数,需要 ELF 中有 .debug_XX 调试符号表,或则有对应的 debuginfo 文件。
perf probe 跟踪所有函数 #
向 perf probe 添加用户程序的函数时,可以指定一个 glob pattern,如 ‘func_*’:
# perf probe -x ./test 'func_*'
Error: event "func_d" already exists.
 Hint: Remove existing event by 'perf probe -d'
       or force duplicates by 'perf probe -f'
       or set 'force=yes' in BPF source.
  Error: Failed to add events.

# perf probe -d probe_test:*
Removed event: probe_test:func_d

# perf probe -x ./test '*'
Added new events:
  probe_test:func_d    (on * in /root/zj/test)
  probe_test:func_c    (on * in /root/zj/test)
  probe_test:func_b    (on * in /root/zj/test)
  probe_test:func_a    (on * in /root/zj/test)
  probe_test:main      (on * in /root/zj/test)

You can now use it in all perf tools, such as:

	perf record -e probe_test:main -aR sleep 1

# perf record -e probe_test:* -g -aR ./test
Hello from A
Hello from B
Hello from C
Hello world from D
[ perf record: Woken up 1 times to write data ]
[ perf record: Captured and wrote 12.568 MB perf.data (5 samples) ]

# perf script
test 104426 [083] 3189986.791451:   probe_test:main: (4005f6)
                  4005f6 main+0x0 (/root/zj/test)

test 104426 [083] 3189986.791458: probe_test:func_a: (4005dc)
                  4005dc func_a+0x0 (/root/zj/test)
            7f4e708de555 __libc_start_main+0xf5 (/usr/lib64/libc-2.17.so)

test 104426 [083] 3189986.791492: probe_test:func_b: (4005c2)
                  4005c2 func_b+0x0 (/root/zj/test)
                  400604 main+0xe (/root/zj/test)
            7f4e708de555 __libc_start_main+0xf5 (/usr/lib64/libc-2.17.so)

test 104426 [083] 3189986.791500: probe_test:func_c: (4005a8)
                  4005a8 func_c+0x0 (/root/zj/test)
                  4005f4 func_a+0x18 (/root/zj/test)
                  400604 main+0xe (/root/zj/test)
            7f4e708de555 __libc_start_main+0xf5 (/usr/lib64/libc-2.17.so)

test 104426 [083] 3189986.791504: probe_test:func_d: (40057d)
                  40057d func_d+0x0 (/root/zj/test)
                  4005da func_b+0x18 (/root/zj/test)
                  4005f4 func_a+0x18 (/root/zj/test)
                  400604 main+0xe (/root/zj/test)
            7f4e708de555 __libc_start_main+0xf5 (/usr/lib64/libc-2.17.so)
perf probe 不支持非 C 程序特定函数追踪 #
go、rust 的函数名通常包含 package 路径,而 perf probe 不支持函数名包含特殊字符,即使使用函数地址,也报错。
- perf-probe: Improbe non-C language support: https://lwn.net/Articles/997329/
- https://lore.kernel.org/all/173073702882.2098439.13342508872190995896.stgit@mhiramat.roam.corp.google.com/
#perf probe -F -x /app/myagent |grep -i store |grep gitlab
git.com/paas/myagent/pkg/storage.(*ProcessStore).SaveNetworkLocateInfo
git.com/paas/myagent/pkg/storage.(*ProcessStore).SaveProcessLocateResult
git.com/paas/myagent/pkg/storage.(*ProcessStore).SetRelistFunc
git.com/paas/myagent/pkg/storage.(*ProcessStore).cleanupByDiskUsed
git.com/paas/myagent/pkg/storage.(*ProcessStore).cleanupByDiskUsed.func1
git.com/paas/myagent/pkg/storage.(*ProcessStore).cleanupOldRecords
git.com/paas/myagent/pkg/storage.(*ProcessStore).doSaveNetworkLocateInfo
git.com/paas/myagent/pkg/storage.NewStore
git.com/paas/myagent/pkg/storage.NewStore.func1
git.com/paas/myagent/pkg/storage.NewStore.func2

#perf probe -x /app/myagent 'SaveNetworkLocateInfo'
Failed to find symbol SaveNetworkLocateInfo in /app/myagent
  Error: Failed to add events.

# perf probe -x /app/myagent 'git.com/paas/myagent/pkg/storage.(\*ProcessStore).SaveNetworkLocateInfo'
Failed to write event: Invalid argument
  Error: Failed to add events.

# nm -n /app/myagent |grep SaveNetwork
00000000012e0220 T git.com/paas/myagent/pkg/storage.(*ProcessStore).SaveNetworkLocateInfo
00000000012e0480 T git.com/paas/myagent/pkg/storage.(*ProcessStore).doSaveNetworkLocateInfo

# perf probe -x /app/myagent --add '0x12e0220'
Failed to write event: Invalid argument
  Error: Failed to add events.
但 perf record 等还能正常使用。
解决办法:使用 bpftrace,它支持 rust、go 带 package path 的函数名。
perf trace 捕获事件 #
类似于 strace, 能捕获各种事件:
- 系统调用函数;
- tracepoint 函数,一般是执行系统调用函数调用的其他内核函数触发的。
应用场景:例如想查那个进程再发送 ICMP 包。但是又不知道应该向哪个 内核函数 插桩。
perf trace 显示每一个函数的参数:
root@lima-ebpf-dev:~# perf trace ping www.baidu.com -c1 > /dev/null
         ? (         ): ping/203535  ... [continued]: execve())                                           = 0
     0.119 ( 0.046 ms): ping/203535 brk()                                                                 = 0x55b19f84a000
     0.606 ( 0.044 ms): ping/203535 arch_prctl(option: 0x3001, arg2: 0x7fffc98478d0)                      = -1 EINVAL (Invalid argument)
     0.714 ( 0.049 ms): ping/203535 mmap(len: 8192, prot: READ|WRITE, flags: PRIVATE|ANONYMOUS)           = 0x7f36617ca000
     0.816 ( 0.050 ms): ping/203535 access(filename: 0x617fbd90, mode: R)                                 = -1 ENOENT (No such file or directory)
     0.916 ( 0.050 ms): ping/203535 openat(dfd: CWD, filename: 0x617fa21b, flags: RDONLY|CLOEXEC)         = 3
     1.010 ( 0.045 ms): ping/203535 newfstatat(dfd: 3, filename: 0x617faee9, statbuf: 0x7fffc9846a20, flag: 4096) = 0
     1.100 ( 0.158 ms): ping/203535 mmap(len: 35835, prot: READ, flags: PRIVATE, fd: 3)                   = 0x7f36617c1000
     1.308 ( 0.044 ms): ping/203535 close(fd: 3)                                                          = 0
     1.403 ( 0.049 ms): ping/203535 openat(dfd: CWD, filename: 0x617ca140, flags: RDONLY|CLOEXEC)         = 3
     1.498 ( 0.045 ms): ping/203535 read(fd: 3, buf: 0x7fffc9846c58, count: 832)                          = 832
     1.588 ( 0.045 ms): ping/203535 newfstatat(dfd: 3, filename: 0x617faee9, statbuf: 0x7fffc9846af0, flag: 4096) = 0
     1.697 ( 0.055 ms): ping/203535 mmap(len: 41016, prot: READ, flags: PRIVATE|DENYWRITE, fd: 3)         = 0x7f36617b6000
     1.797 ( 0.067 ms): ping/203535 mmap(addr: 0x7f36617b9000, len: 16384, prot: READ|EXEC, flags: PRIVATE|FIXED|DENYWRITE, fd: 3, off: 0x3000) = 0x7f36617b9000
     1.912 ( 0.050 ms): ping/203535 mmap(addr: 0x7f36617bd000, len: 8192, prot: READ, flags: PRIVATE|FIXED|DENYWRITE, fd: 3, off: 0x7000) = 0x7f36617bd000
     2.007 ( 0.049 ms): ping/203535 mmap(addr: 0x7f36617bf000, len: 8192, prot: READ|WRITE, flags: PRIVATE|FIXED|DENYWRITE, fd: 3, off: 0x8000) = 0x7f36617bf000
...
   279.945 ( 0.049 ms): ping/203535 close(fd: 1</dev/null>)                                               = 0
   280.046 ( 0.065 ms): ping/203535 close(fd: 2</dev/pts/1>)                                              = 0
   280.185 (         ): ping/203535 exit_group()                                                          = ?
root@lima-ebpf-dev:~#
通过指定 -e glob,可以只捕获符合 glob 匹配的内核事件,如向捕获执行 ping 命令式,内核内部执行了那些 net tracepoint 函数:
root@lima-ebpf-dev:~# perf trace --no-syscalls --event 'net:*' ping www.baidu.com -c1 > /dev/null
     0.000 ping/203626 net:net_dev_queue(skbaddr: 0xffff99fac46fc400, len: 84, name: "lo")
     0.061 ping/203626 net:net_dev_start_xmit(name: "lo", skbaddr: 0xffff99fac46fc400, protocol: 2048, ip_summed: 3, len: 84, network_offset: 14, transport_offset_valid: 1, transport_offset: 34)
     0.099 ping/203626 net:netif_rx_entry(name: "lo", napi_id: 2, skbaddr: 0xffff99fac46fc400, protocol: 2048, ip_summed: 3, hash: 190000638, l4_hash: 1, len: 70, truesize: 768, mac_header_valid: 1, mac_header: 4294967282)
     0.139 ping/203626 net:netif_rx(skbaddr: 0xffff99fac46fc400, len: 70, name: "lo")
     0.173 ping/203626 net:netif_rx_exit(skbaddr: 0xffff99fac46fc400, len: 70, name: "lo")
     0.206 ping/203626 net:net_dev_xmit(skbaddr: 0xffff99fac46fc400, len: 84, name: "lo")
...
root@lima-ebpf-dev:~#
比如,如果想通过 bpftrace 来捕获发送 icmp 包的进程,则可以从上面 perf trace 的输出结果中来看,对 net_dev_start_xmit 函数进行插桩是比较合适的选择:
- 任意内核函数插桩,建议使用 kfunc 类型,因为可以使用 -lv 来看 kfunc 的参数列表,后面使用 args.
来引用函数参数。 - 如果使用 kprobe 类型,则不支持查看函数列表,需要使用 argN 来引用每一个函数参数。
# 对内核函数关键字进行搜索,不一定完整匹配
root@lima-ebpf-dev:~# bpftrace -lv 'kfunc:net_dev_start_xmit'
root@lima-ebpf-dev:~# bpftrace -lv 'kfunc:*' |grep net_dev |grep xmit
kfunc:vmlinux:__traceiter_net_dev_start_xmit
kfunc:vmlinux:__traceiter_net_dev_xmit
kfunc:vmlinux:__traceiter_net_dev_xmit_timeout

root@lima-ebpf-dev:~# bpftrace -lv 'kfunc:vmlinux:__traceiter_net_dev_start_xmit'
kfunc:vmlinux:__traceiter_net_dev_start_xmit
    void * __data
    const struct sk_buff * skb
    const struct net_device * dev
    int retval
内核对应的 net_dev_start_xmit trace event 定义:
TRACE_EVENT(net_dev_start_xmit,

	TP_PROTO(const struct sk_buff *skb, const struct net_device *dev),

	TP_ARGS(skb, dev),

	TP_STRUCT__entry(
		__string(	name,			dev->name	)
		__field(	u16,			queue_mapping	)
		__field(	const void *,		skbaddr		)
		__field(	bool,			vlan_tagged	)
		__field(	u16,			vlan_proto	)
		__field(	u16,			vlan_tci	)
		__field(	u16,			protocol	)
		__field(	u8,			ip_summed	)
		__field(	unsigned int,		len		)
		__field(	unsigned int,		data_len	)
		__field(	int,			network_offset	)
		__field(	bool,			transport_offset_valid)
		__field(	int,			transport_offset)
		__field(	u8,			tx_flags	)
		__field(	u16,			gso_size	)
		__field(	u16,			gso_segs	)
		__field(	u16,			gso_type	)
	),

	TP_fast_assign(
		__assign_str(name, dev->name);
		__entry->queue_mapping = skb->queue_mapping;
		__entry->skbaddr = skb;
		__entry->vlan_tagged = skb_vlan_tag_present(skb);
		__entry->vlan_proto = ntohs(skb->vlan_proto);
		__entry->vlan_tci = skb_vlan_tag_get(skb);
		__entry->protocol = ntohs(skb->protocol);
		__entry->ip_summed = skb->ip_summed;
		__entry->len = skb->len;
		__entry->data_len = skb->data_len;
		__entry->network_offset = skb_network_offset(skb);
		__entry->transport_offset_valid =
			skb_transport_header_was_set(skb);
		__entry->transport_offset = skb_transport_offset(skb);
		__entry->tx_flags = skb_shinfo(skb)->tx_flags;
		__entry->gso_size = skb_shinfo(skb)->gso_size;
		__entry->gso_segs = skb_shinfo(skb)->gso_segs;
		__entry->gso_type = skb_shinfo(skb)->gso_type;
	),

	TP_printk("dev=%s queue_mapping=%u skbaddr=%p vlan_tagged=%d vlan_proto=0x%04x vlan_tci=0x%04x protocol=0x%04x ip_summed=%d len=%u data_len=%u network_offset=%d transport_offset_valid=%d transport_offset=%d tx_flags=%d gso_size=%d gso_segs=%d gso_type=%#x",
		  __get_str(name), __entry->queue_mapping, __entry->skbaddr,
		  __entry->vlan_tagged, __entry->vlan_proto, __entry->vlan_tci,
		  __entry->protocol, __entry->ip_summed, __entry->len,
		  __entry->data_len,
		  __entry->network_offset, __entry->transport_offset_valid,
		  __entry->transport_offset, __entry->tx_flags,
		  __entry->gso_size, __entry->gso_segs, __entry->gso_type)
)
另一个例子:
$ sudo bpftrace -e '
> tracepoint:syscalls:sys_enter_open,
> tracepoint:syscalls:sys_enter_openat
> {
>         $mysecret = str(args->filename);
>         if ( $mysecret == "homework" ) {
>             printf("Somebody touch my file ! Call the police !\n");
>         }
> }
> '
Attaching 2 probes...Somebody touch my file ! Call the police !
^C

$ sudo bpftrace -e 'tracepoint:syscalls:sys_enter_execve   {
  printf("%-10u %-5d ", elapsed / 1000000, pid);
  join(args->argv);
}
'
perf ftrace 追踪函数 #
https://mp.weixin.qq.com/s/kZfmtbbcTwumyJ7I551Xpw
为了测试方便,将 eth1 的网卡队列设置为 1,并且将网卡中断绑定到 CPU0。
ethtool -L eth1 combined 1
echo 0 > /proc/irq/$(cat /proc/interrupts | awk -F ':' '/eth1/ {gsub(/ /,""); print $1}')/smp_affinity_list
- 收包路径:perf ftrace -G ‘_netif_receive_skb_list_core’ -g ‘smp*’
- 发包路径:perf ftrace -G ‘_netif_receive_skb_core’ -g ‘smp*’
参考:
- Debugging the kernel using Ftrace - part 1: https://lwn.net/Articles/365835/
- Debugging the kernel using Ftrace - part 2: https://lwn.net/Articles/366796/
采样和追踪容器进程 #
容器进程在独立的 mount ns 中,即根文件系统和 Host 是独立的,需要在 Host 上上到容器内使用的二进制和库文件,然后做符号解析和函数追踪。
在 Host 上查找容器内二进制文件,由两种方式:
/proc/<pid>/root- 查找容器 mergedDir
# ls  /proc/102366/root/
apsara  bin  boot  dev  entrypoint.sh  etc  home  lib  lib64  lost+found  media  mnt  nsenter  opt  proc  root  run  sbin  srv  sys  tmp  usr  var

# ls -l  /proc/102366/exe
lrwxrwxrwx 1 root root 0 Jan  9 16:11 /proc/102366/exe -> /usr/bin/plugin.csi.cloud.com

# ls -l  /proc/102366/root/usr/bin/plugin.csi.cloud.com
-rwxr-xr-x 1 root root 82455166 Jan  9 13:23 /proc/102366/root/usr/bin/plugin.csi.cloud.com
另外也可以根据容器的 .GraphDriver.Data.MergedDir 来在 Host 上查找容器内路径的二进制路径。例如,如果想跟踪 cilium-agent 进程(本身是用 docker 容器部署的),首先需要找到 cilium-agent 文件在宿主机上的绝对路径,可以通过 container ID 或 name 找:
- merged path 是容器使用的 overlay 根文件系统。
# Check cilium-agent container
$ docker ps | grep cilium-agent
0eb2e76384b3        cilium:test   "/usr/bin/cilium-agent ..."   4 hours ago    Up 4 hours   cilium-agent

# Find the merged path for cilium-agent container
$ docker inspect --format "{{.GraphDriver.Data.MergedDir}}" 0eb2e76384b3
/var/lib/docker/overlay2/a17f868d/merged # a17f868d.. is shortened for better viewing

# The object file we are going to trace
$ ls -ahl /var/lib/docker/overlay2/a17f868d/merged/usr/bin/cilium-agent
-rwxr-xr-x 1 root root 86M /var/lib/docker/overlay2/a17f868d/merged/usr/bin/cilium-agent
perf 命令感知进程对应的 cgroup,如果发现它是其它 mount 或 pid ns 中的进程,则自动到对应的 cgruop rootfs 下查找二进制和对应的 debuginfo 信息。
Host System
├── /proc/<container_pid>/
│   ├── root/ (容器根文件系统)
│   ├── exe (二进制链接)
│   └── maps (内存映射)
└── /usr/lib/debug/ (调试符号)
判断是否是容器进程的依据是:NSpid 字段:
$ cat /proc/1229/status | grep NSpid
NSpid: 1229

$ cat /proc/11459/status | grep NSpid
NSpid: 11459 1
11459 是在宿主机的 pid ns 内的进程 ID,1 是在容器自己的 pid ns 的进程 ID
如果要对指定 cgroup 进行 syscall tracing/probe,则需要使用 –cgroup/-G 来指定 /sys/fs/cgroup/perf_event 下的 cgrup 路径。
# ls /sys/fs/cgroup/perf_event/docker/
59a016887a1b563799d1f5d942f420ab37f9e99be68996e80ffc68fdc96e06ff  a38dc1db0ad27317bbe8914e0e25930e0b7650d2b3c6bb10860dbf797cfba770  cgroup.procs       tasks
9c2281e2be0997da155140b9316c3703f1e1f85838219552b0a4a08741190058  cgroup.clone_children                                             notify_on_release

# docker exec -it 9c2281e2be09 sh
/bin # cat /proc/self/cgroup
12:freezer:/docker/9c2281e2be0997da155140b9316c3703f1e1f85838219552b0a4a08741190058
11:pids:/docker/9c2281e2be0997da155140b9316c3703f1e1f85838219552b0a4a08741190058
10:devices:/docker/9c2281e2be0997da155140b9316c3703f1e1f85838219552b0a4a08741190058
9:blkio:/docker/9c2281e2be0997da155140b9316c3703f1e1f85838219552b0a4a08741190058
8:cpuset:/docker/9c2281e2be0997da155140b9316c3703f1e1f85838219552b0a4a08741190058
7:rdma:/docker/9c2281e2be0997da155140b9316c3703f1e1f85838219552b0a4a08741190058
6:hugetlb:/docker/9c2281e2be0997da155140b9316c3703f1e1f85838219552b0a4a08741190058
5:perf_event:/docker/9c2281e2be0997da155140b9316c3703f1e1f85838219552b0a4a08741190058
4:net_cls,net_prio:/docker/9c2281e2be0997da155140b9316c3703f1e1f85838219552b0a4a08741190058
3:cpu,cpuacct:/docker/9c2281e2be0997da155140b9316c3703f1e1f85838219552b0a4a08741190058
2:memory:/docker/9c2281e2be0997da155140b9316c3703f1e1f85838219552b0a4a08741190058
1:name=systemd:/docker/9c2281e2be0997da155140b9316c3703f1e1f85838219552b0a4a08741190058
0::/docker/9c2281e2be0997da155140b9316c3703f1e1f85838219552b0a4a08741190058
/bin #

# perf record -F 99 -e cpu-clock --cgroup=docker/9c2281e2be099 -a -- sleep 10
另一例子:
# docker exec 879e9059287c cat /proc/self/cgroup
12:pids:/my_private.slice/docker-879e9059287c1d7a4092ed4682ee2471834f6e1ef4399c73b26277e1a29658eb.scope
11:devices:/my_private.slice/docker-879e9059287c1d7a4092ed4682ee2471834f6e1ef4399c73b26277e1a29658eb.scope
10:memory:/my_private.slice/docker-879e9059287c1d7a4092ed4682ee2471834f6e1ef4399c73b26277e1a29658eb.scope
9:cpu,cpuacct:/my_private.slice/docker-879e9059287c1d7a4092ed4682ee2471834f6e1ef4399c73b26277e1a29658eb.scope
8:blkio:/my_private.slice/docker-879e9059287c1d7a4092ed4682ee2471834f6e1ef4399c73b26277e1a29658eb.scope
7:hugetlb:/my_private.slice/docker-879e9059287c1d7a4092ed4682ee2471834f6e1ef4399c73b26277e1a29658eb.scope
6:perf_event:/my_private.slice/docker-879e9059287c1d7a4092ed4682ee2471834f6e1ef4399c73b26277e1a29658eb.scope
5:freezer:/my_private.slice/docker-879e9059287c1d7a4092ed4682ee2471834f6e1ef4399c73b26277e1a29658eb.scope
4:rdma:/
3:net_cls,net_prio:/my_private.slice/docker-879e9059287c1d7a4092ed4682ee2471834f6e1ef4399c73b26277e1a29658eb.scope
2:cpuset:/my_private.slice/docker-879e9059287c1d7a4092ed4682ee2471834f6e1ef4399c73b26277e1a29658eb.scope
1:name=systemd:/my_private.slice/docker-879e9059287c1d7a4092ed4682ee2471834f6e1ef4399c73b26277e1a29658eb.scope

# perf stat -e "syscalls:*" -G  my_private.slice/docker-879e9059287c1d7a4092ed4682ee2471834f6e1ef4399c73b26277e1a29658eb.scope -a
perf 实验 #
# gcc test.c  -o test

# file test
test: ELF 64-bit LSB executable, x86-64, version 1 (SYSV), dynamically linked (uses shared libs), for GNU/Linux 2.6.32, BuildID[sha1]=cf5aa8fa3e8950c6e5c71b2588d8b2e8bf40f175, not stripped

# readelf -S ./test |grep -E 'sym|debug|eh_'
  [ 5] .dynsym           DYNSYM           00000000004002b8  000002b8
  [16] .eh_frame_hdr     PROGBITS         00000000004006dc  000006dc
  [17] .eh_frame         PROGBITS         0000000000400730  00000730
  [27] .symtab           SYMTAB           0000000000000000  00001098

# nm test |grep func
00000000004005dc T func_a
00000000004005c2 T func_b
00000000004005a8 T func_c
000000000040057d T func_d

# strings test |grep func
func_b
func_d
func_a
func_c

# 没有加 -g,默认不捕获函数调用栈,
# 没有加 -e,默认使用 cycles:ppp
# perf record ./test
Hello from A
Hello from B
Hello from C
Hello world from D
[ perf record: Woken up 1 times to write data ]
[ perf record: Captured and wrote 0.030 MB perf.data (10 samples) ]

# perf report 并不显示函数调用栈
# perf report  --stdio |cat -
# To display the perf.data header info, please use --header/--header-only options.
#
#
# Total Lost Samples: 0
#
# Samples: 9  of event 'cycles:ppp'
# Event count (approx.): 1717500
#
# Overhead  Command  Shared Object      Symbol
# ........  .......  .................  ............................
#
    63.50%  test     [kernel.kallsyms]  [k] sync_regs
    32.86%  test     [kernel.kallsyms]  [k] vma_interval_tree_insert
     3.29%  perf     [kernel.kallsyms]  [k] do_nmi
     0.32%  perf     [kernel.kallsyms]  [k] acpi_os_read_memory
     0.03%  perf     [kernel.kallsyms]  [k] native_write_msr

# perf script
            perf 41565 3185673.474644:          1 cycles:ppp:  ffffffffaf067b74 native_write_msr+0x4 ([kernel.kallsyms])
            perf 41565 3185673.474657:          1 cycles:ppp:  ffffffffaf067b74 native_write_msr+0x4 ([kernel.kallsyms])
            perf 41565 3185673.474659:          4 cycles:ppp:  ffffffffaf067b74 native_write_msr+0x4 ([kernel.kallsyms])
            perf 41565 3185673.474663:         47 cycles:ppp:  ffffffffaf067b74 native_write_msr+0x4 ([kernel.kallsyms])
            perf 41565 3185673.474666:        506 cycles:ppp:  ffffffffaf067b76 native_write_msr+0x6 ([kernel.kallsyms])
            perf 41565 3185673.474669:       5450 cycles:ppp:  ffffffffaf49bdc5 acpi_os_read_memory+0x35 ([kernel.kallsyms])
            perf 41565 3185673.474672:      56442 cycles:ppp:  ffffffffaf029f59 do_nmi+0x99 ([kernel.kallsyms])
            test 41565 3185673.474702:     564369 cycles:ppp:  ffffffffaf2268dc vma_interval_tree_insert+0x2c ([kernel.kallsyms])
            test 41565 3185673.474986:    1090680 cycles:ppp:  ffffffffaf02538e sync_regs+0x1e ([kernel.kallsyms])

# 加 -g 时捕获函数调用栈
# perf record -g  ./test
Hello from A
Hello from B
Hello from C
Hello world from D
[ perf record: Woken up 1 times to write data ]
[ perf record: Captured and wrote 0.031 MB perf.data (11 samples) ]
# perf report  --stdio |head -20
# To display the perf.data header info, please use --header/--header-only options.
#
#
# Total Lost Samples: 0
#
# Samples: 11  of event 'cycles:ppp'
# Event count (approx.): 1310813
#
# Children      Self  Command  Shared Object      Symbol
# ........  ........  .......  .................  .......................................
#
    75.09%     0.00%  test     [kernel.kallsyms]  [k] page_fault
            |
            ---page_fault
               do_page_fault
               __do_page_fault
               handle_mm_fault
               |
                --35.97%--__handle_mm_fault
                          do_anonymous_page
# 但是并没有捕获到用户函数的调用栈
# perf report  --stdio |grep func_

# 如果要捕获用户函数,则需要使用 perf probe
# 查看 ./test 中可以 probe 的用户函数列表
# perf probe -F -x ./test
completed.6355
data_start
deregister_tm_clones
frame_dummy
func_a
func_b
func_c
func_d
main
puts@plt
register_tm_clones
usleep@plt

# perf probe -x ./test 'func_d'
Added new event:
  probe_test:func_d    (on func_d in /root/zj/test)

You can now use it in all perf tools, such as:

	perf record -e probe_test:func_d -aR sleep 1

# 然后执行 perf record 时需要加 -g 才能捕获函数调用栈,
# 或者使用 dwarf 来 unwinding(使用默认生成的 .eh_frame)
# perf record -e probe_test:func_d -aR ./test # perf record -e probe_test:func_d --call-graph=dwarf -aR ./test
Hello from A
Hello from B
Hello from C
Hello world from D
[ perf record: Woken up 1 times to write data ]
[ perf record: Captured and wrote 11.330 MB perf.data (1 samples) ]

# perf script
test 104460 [076] 3186931.797081: probe_test:func_d_1: (40057d)
                  40057d func_d+0x0 (/root/zj/test)
                  4005bf func_c+0x17 (/root/zj/test)
                  4005d9 func_b+0x17 (/root/zj/test)
                  4005f3 func_a+0x17 (/root/zj/test)
                  400603 main+0xd (/root/zj/test)
            7fb599014444 __libc_start_main+0xf4 (/usr/lib64/libc-2.17.so)
                  4004b8 _start+0x28 (/root/zj/test)

# perf report  --stdio |cat -
# To display the perf.data header info, please use --header/--header-only options.
#
#
# Total Lost Samples: 0
#
# Samples: 1  of event 'probe_test:func_d'
# Event count (approx.): 1
#
# Children      Self  Trace output
# ........  ........  ............
#
   100.00%   100.00%  (40057d)
            |
            ---__libc_start_main
               main
               func_a
               func_b
               func_d

# perf record -e probe_test:func_d_1  --proc-map-timeout 100  -aR ./test
Hello from A
Hello from B
Hello from C
Hello world from D
[ perf record: Woken up 1 times to write data ]
[ perf record: Captured and wrote 11.845 MB perf.data (1 samples) ]
# perf script
            test 129241 [084] 3187206.870347: probe_test:func_d_1: (40057d)

# perf record -e probe_test:func_d_1  --proc-map-timeout 500 -g -aR ./test
Hello from A
Hello from B
Hello from C
Hello world from D
[ perf record: Woken up 1 times to write data ]
[ perf record: Captured and wrote 11.404 MB perf.data (1 samples) ]

# perf script
test 76042 [073] 3187258.344951: probe_test:func_d_1: (40057d)
                  40057d func_d+0x0 (/root/zj/test)
                  4005da func_b+0x18 (/root/zj/test)
                  4005f4 func_a+0x18 (/root/zj/test)
                  400604 main+0xe (/root/zj/test)
            7f8f5e361445 __libc_start_main+0xf5 (/usr/lib64/libc-2.17.so)

# perf record -e probe_test:func_d_1  --proc-map-timeout 500 --call-graph fp -aR ./test
Hello from A
Hello from B
Hello from C
Hello world from D
[ perf record: Woken up 1 times to write data ]
[ perf record: Captured and wrote 11.476 MB perf.data (1 samples) ]

# perf script
test 103396 [068] 3187282.462500: probe_test:func_d_1: (40057d)
                    40057d func_d+0x0 (/root/zj/test)
                    4005da func_b+0x18 (/root/zj/test)
                    4005f4 func_a+0x18 (/root/zj/test)
                    400604 main+0xe (/root/zj/test)
            7feeb9598445 __libc_start_main+0xf5 (/usr/lib64/libc-2.17.so)


# gcc ./test.c  -o test -fomit-frame-pointer
# perf probe -l
  kprobes:aegis___x64_sys_execve (on __x64_sys_execve with s0 s1 s2 s3 s4 s5 s6 s7 s8 s9 s10 s11 s12 s13 s14 s15 file arg1 arg2 arg3 arg4 arg5 ar
  kprobes:aegis_do_execve (on do_execve with s0 s1 s2 s3 s4 s5 s6 s7 s8 s9 s10 s11 s12 s13 s14 s15 file arg1 arg2 arg3 arg4 arg5 arg6 arg7 arg8 a
  kprobes:aegis_do_sys_open (on do_sys_open with dfd file flag)
  kprobes:aegis_proc_fork_connector (on proc_fork_connector with tgid pid parent_tgid parent_pid)
  kprobes:aegis_tcp_connect (on tcp_connect with saddr daddr sport dport)
  probe_test:func_d    (on func_d in /root/zj/test)
  probe_test:func_d_1  (on func_d in /root/zj/test)

# perf probe -d probe_test:*
Removed event: probe_test:func_d
Removed event: probe_test:func_d_1

# perf probe -x ./test 'func_d'
Added new event:
  probe_test:func_d    (on func_d in /root/zj/test)

You can now use it in all perf tools, such as:

	perf record -e probe_test:func_d -aR sleep 1

# perf record -e probe_test:func_d -aR -g ./test
Hello from A
Hello from B
Hello from C
Hello world from D
[ perf record: Woken up 1 times to write data ]
[ perf record: Captured and wrote 11.281 MB perf.data (1 samples) ]

# perf script
test 85054 [093] 3187435.293375: probe_test:func_d: (40057d)
                  40057d func_d+0x0 (/root/zj/test)


# perf record -e probe_test:func_d -aR --call-graph dwarf ./test
Hello from A
Hello from B
Hello from C
Hello world from D
[ perf record: Woken up 1 times to write data ]
[ perf record: Captured and wrote 29.288 MB perf.data (1 samples) ]

# perf script
test 106253 [094] 3187527.044076: probe_test:func_d: (40057d)
                  40057d func_d+0x0 (/root/zj/test)
                  4005c0 func_c+0x17 (/root/zj/test)
                  4005dd func_b+0x17 (/root/zj/test)
                  4005fa func_a+0x17 (/root/zj/test)
                  40060d main+0xd (/root/zj/test)
            7f15c70ca444 __libc_start_main+0xf4 (/usr/lib64/libc-2.17.so)
                  4004b8 _start+0x28 (/root/zj/test)


# perf annotate --stdio2
Samples: 1  of event 'probe_test:func_d', 1 Hz, Event count (approx.): 1, [percent: local period]
func_d() /root/zj/test
Percent


            Disassembly of section .text:

            000000000040057d <func_d>:
            func_d():
100.00        push   %rbp
              mov    %rsp,%rbp
              sub    $0x10,%rsp
              movl   $0x1,-0x4(%rbp)
              mov    $0x4006a0,%edi
            → callq  puts@plt
              mov    -0x4(%rbp),%eax
              imul   $0x2710,%eax,%eax
              mov    %eax,%edi
            → callq  usleep@plt
              leaveq
            ← retq

# gcc ./test.c  -g -o test
# readelf -S ./test  |grep debug
  [27] .debug_aranges    PROGBITS         0000000000000000  00001096
  [28] .debug_info       PROGBITS         0000000000000000  000010c6
  [29] .debug_abbrev     PROGBITS         0000000000000000  000011ce
  [30] .debug_line       PROGBITS         0000000000000000  0000124d
  [31] .debug_str        PROGBITS         0000000000000000  0000129a
# perf record -e probe_test:func_d -aR --call-graph dwarf ./test
  Hello from A
  Hello from B
  Hello from C
  Hello world from D
  [ perf record: Woken up 1 times to write data ]
  [ perf record: Captured and wrote 27.890 MB perf.data (1 samples) ]
# perf annotate --stdio2
  Samples: 1  of event 'probe_test:func_d', 1 Hz, Event count (approx.): 1, [percent: local period]
  func_d() /root/zj/test
  Percent


              Disassembly of section .text:

              000000000040057d <func_d>:
              func_d():
              #include <stdio.h>
              #include <unistd.h>

              void func_d() {
  100.00        push   %rbp
                mov    %rsp,%rbp
                sub    $0x10,%rsp
                                  int msec=1;
                movl   $0x1,-0x4(%rbp)
                                                  printf("%s","Hello world from D\n");
                mov    $0x4006a0,%edi
              → callq  puts@plt
                                                                  usleep(10000*msec);
                mov    -0x4(%rbp),%eax
                imul   $0x2710,%eax,%eax
                mov    %eax,%edi
              → callq  usleep@plt
              }
                leaveq
              ← retq
报错:
# perf record -e probe_test:func_d_1 --call-graph=dwarf -aR ./test
Reading /proc/101522/task/101522/maps time out. You may want to increase the time limit by --proc-map-timeout
Hello from A
Hello from B
Hello from C
Hello world from D
[ perf record: Woken up 1 times to write data ]
Warning:
1 map information files for pre-existing threads were
not processed, if there are samples for addresses they
will not be resolved, you may find out which are these
threads by running with -v and redirecting the output
to a file.
The time limit to process proc map is too short?
Increase it by --proc-map-timeout
[ perf record: Captured and wrote 28.158 MB perf.data (1 samples) ]

# perf record -e probe_test:func_d_1 --call-graph=dwarf --proc-map-timeout 100 -aR ./test
Hello from A
Hello from B
Hello from C
Hello world from D
[ perf record: Woken up 1 times to write data ]
[ perf record: Captured and wrote 29.081 MB perf.data (1 samples) ]
使用 perf 分析 python 程序 #
python 3.12 版本开始为 perf 提供了原生支持,即可以使用 perf 对 python 脚本程序中的函数进行调用栈展开和热点分析。
对于 CPython 来说,其 Native Code 执行的只是 VM 一层的代码,在 VM 内单独抽象了一套类似 native 的栈帧结构,核心结构如下:
struct _frame {
    PyObject_HEAD
    PyFrameObject *f_back;      /* previous frame, or NULL */
    struct _PyInterpreterFrame *f_frame; /* points to the frame data */
    PyObject *f_trace;          /* Trace function */
    int f_lineno;               /* Current line number. Only valid if non-zero */
    char f_trace_lines;         /* Emit per-line trace events? */
    char f_trace_opcodes;       /* Emit per-opcode trace events? */
    char f_fast_as_locals;      /* Have the fast locals of this frame been converted to a dict? */
    /* The frame data, if this frame object owns the frame */
    PyObject *_f_frame_data[1];
};

typedef struct _PyInterpreterFrame {
    PyObject *f_executable; /* Strong reference */
    struct _PyInterpreterFrame *previous;
    PyObject *f_funcobj; /* Strong reference. Only valid if not on C stack */
    PyObject *f_globals; /* Borrowed reference. Only valid if not on C stack */
    PyObject *f_builtins; /* Borrowed reference. Only valid if not on C stack */
    PyObject *f_locals; /* Strong reference, may be NULL. Only valid if not on C stack */
    PyFrameObject *frame_obj; /* Strong reference, may be NULL. Only valid if not on C stack */
    // NOTE: This is not necessarily the last instruction started in the given
    // frame. Rather, it is the code unit *prior to* the *next* instruction. For
    // example, it may be an inline CACHE entry, an instruction we just jumped
    // over, or (in the case of a newly-created frame) a totally invalid value:
    _Py_CODEUNIT *prev_instr;
    int stacktop;  /* Offset of TOS from localsplus  */
    /* The return_offset determines where a `RETURN` should go in the caller,
     * relative to `prev_instr`.
     * It is only meaningful to the callee,
     * so it needs to be set in any CALL (to a Python function)
     * or SEND (to a coroutine or generator).
     * If there is no callee, then it is meaningless. */
    uint16_t return_offset;
    char owner;
    /* Locals and stack */
    PyObject *localsplus[1];
} _PyInterpreterFrame;
这里不难理解,每个栈帧中都包含了当前栈帧的上一个栈帧的指针,这样就形成了一个完整的栈结构。
同时我们能看到,在 Python 的栈帧结构中包含了很多重要的信息,
- 当前执行的 opcode
- 当前所对应的行号(类似于符号表存在)
- 当前的局部,全局变量
- 我们所有的 trace / 回溯的操作,都需要来基于这些信息来进行。
Python 3.12 的 perf 支持
我们都知道,对于非 NATIVE CODE 来说,perf 很多时候没有办法生效,因为你找不到对应的地址和具体的符号之间的映射,也无从谈起去采样。
好在 2009 年 Linux 3.x 之后,perf 提供新的功能,它允许用户往 /tmp/perf-%d.map 文件中写入地址与符号之间的映射,这样 perf 就可以通过这个文件来解析地址了。具体可以参见 perf report: Add support for profiling JIT generated code share3
perf report: Add support for profiling JIT generated code
This patch adds support for profiling JIT generated code to ‘perf report’. A JIT compiler is required to generate a “/tmp/perf-$PID.map” symbols map that is parsed when looking and displaying symbols.
JIT 编译器会生成 “/tmp/perf-$PID.map” 符号表文件,例如 cpython。
在 Java/Node.js 都对于这个功能有了支持后,Python 也在 3.12 中提供了对于这个功能的支持,具体可以参见 gh-96143: Allow Linux perf profiler to see Python calls4
我们看到这里的汇编其实就是一个简单的 call 操作,然后将返回值返回即可。等价于:
PyObject *
trampoline(PyThreadState *ts, _PyInterpreterFrame *f,
           int throwflag, py_evaluator evaluator)
{
    return evaluator(ts, f, throwflag);
}
那么我们其实这里的思路就不难理解了,我们在编译 trampoline 的时候,会将对应的 FrameObject 传入到 trampoline 中,然后我们在 perf map 文件写入的时候,实际上是将符号与内存中的一块固定区域进行了 binding。这样让我们的 perf 就可以通过 perf map 文件来解析对应的符号了。
perf map 文件的内容:
7f0caf8aa70c b py::_path_abspath:<frozen importlib._bootstrap_external>
7f0caf8aa717 b py::_path_isabs:<frozen importlib._bootstrap_external>
7f0caf8aa722 b py::FileFinder._fill_cache:<frozen importlib._bootstrap_external>
7f0caf8aa72d b py::execusercustomize:<frozen site>
7f0caf8aa738 b py::_read_directory:<frozen zipimport>
7f0caf8aa743 b py::FileLoader.__init__:<frozen importlib._bootstrap_external>
7f0caf8aa74e b py::<module>:/home/manjusaka/Documents/projects/cpython/demo.py
7f0caf8aa759 b py::baz:/home/manjusaka/Documents/projects/cpython/demo.py
7f0caf8aa764 b py::bar:/home/manjusaka/Documents/projects/cpython/demo.py
7f0caf8aa76f b py::foo:/home/manjusaka/Documents/projects/cpython/demo.py
这样的好处有很多,我们可以利用 Linux 本身的 perf 生态,来完成很多基本的工作(比如火焰图)
同时我们在去做一些具体的函数的 trace 的时候,我们也可以利用 uprobe 之类的工具,基于我们在 perf 中写入的映射,来做更进一步的 trace,这也让整个 Python 程序的 trace 变的更容易,不用考虑汇编,不用考虑平台(其实也要考虑的(目前只有 ARM/X86 支持))
总结
Python 3.12 这个新特性真的是又新又好,实现的非常巧妙。其实之前和人讨论到 WASM 的 perf 的支持的时候,我第一反应也是可以参考 Python 中类似的做法,不过 WASM 先把自己的 WASI 搞成熟吧,不然花式 host function 也没啥 perf/trace 的必要了。
参考:https://zheaoli-github-io.vercel.app/posts/2023/10/05/the-perf-feature-python-312/
python perf 测试 #
参考文档:Python support for the Linux perf profiler: https://github.com/python/cpython/blob/main/Doc/howto/perf_profiling.rst
需要 Python 3.12 及以后版本, 确认方式如下:
root@idev2-x86:~# python3 -m sysconfig | grep HAVE_PERF_TRAMPOLINE
	PY_HAVE_PERF_TRAMPOLINE = "1"

root@idev2-x86:~# uname -a
Linux idev2-x86 6.8.0-51-generic #52-Ubuntu SMP PREEMPT_DYNAMIC Thu Dec  5 13:09:44 UTC 2024 x86_64 x86_64 x86_64 GNU/Linux

root@idev2-x86:~# cat /etc/lsb-release
DISTRIB_ID=Ubuntu
DISTRIB_RELEASE=24.04
DISTRIB_CODENAME=noble
DISTRIB_DESCRIPTION="Ubuntu 24.04.2 LTS"
测试程序:
def foo(n):
    result = 0
    for _ in range(n):
        result += 1
    return result

def bar(n):
    foo(n)

def baz(n):
    bar(n)

if __name__ == "__main__":
    baz(1000000)
三种 perf 方式:
- 使用环境变量;
$ PYTHONPERFSUPPORT=1 perf record -F 9999 -g -o perf.data python script.py
$ perf report -g -i perf.data
- 使用 python 的 -X perf 参数
$ perf record -F 9999 -g -o perf.data python -X perf script.py
$ perf report -g -i perf.data
- 使用 API
import sys

sys.activate_stack_trampoline("perf")
do_profiled_stuff()
sys.deactivate_stack_trampoline()

non_profiled_stuff()
执行:
$ perf record -F 9999 -g -o perf.data python ./example.py
$ perf report -g -i perf.data
另外,为了取得最好结果,Python 解释器应该关闭 FP,这样 perf 只使用 DWARF 来进行调用栈展开:
root@idev2-x86:~# python -m sysconfig | grep 'no-omit-frame-pointer'

# 在关闭 FP 后,使用 --call-graph dwarf 参数
$ perf record -F 9999 -g --call-graph dwarf -o perf.data python -Xperf_jit my_script.py
$ perf inject -i perf.data --jit --output perf.jit.data
$ perf report -g -i perf.jit.data

# 或者,使用环境变量
$ PYTHON_PERF_JIT_SUPPORT=1 perf record -F 9999 -g --call-graph dwarf -o perf.data python my_script.py
$ perf inject -i perf.data --jit --output perf.jit.data
$ perf report -g -i perf.jit.data
perf mem CPU Cache 命中统计 #
参考 #
- https://www.brendangregg.com/perf.html
- https://medium.com/coccoc-engineering-blog/practical-linux-tracing-part-2-x-profiling-vs-event-tracing-89f76113e0fd
- https://phoenixnap.com/kb/linux-perf
- https://tungdam.medium.com/practical-tracing-a-final-recap-5d7e16e4a9df
- https://zheaoli-github-io.vercel.app/posts/2023/10/05/the-perf-feature-python-312/
- redhat 性能调优文档