gdb 个人速查手册。
打开内核的核心转储机制,这样才能产生 core 文件: ulimit -c unlimited
编译时加 -g 或 -ggdb 选项,生成的可执行文件中包含调试信息: gcc -g -o outPutName sourceCodeName.c
同时建议不对代码进行优化,防止部分函数被 inline,调试时不能找到源码。
- C/C++: -O0 表示关闭优化;
启动 gdb #
gdb binary      # 启动 gdb,指定可执行程序
gdb binary core # 启动 gdb,指定可执行程序和 core, 停止在出 core 的位置
gdb             # 启动 gdb,使用 file 和 core 命令加载程序和 core 文件
  file binary
  core core
gdb binary pid  # 启动 gdb,指定可执行程序和 pid
gdb --pid=PID   # 启动 gdb,调试指定 pid
gdb --pid=PID --directory=DIR # 启动 gdb,指定源码目录
帮助信息 #
help                      # 列出命令分类
help running              # 查看某个类别的帮助信息
help run                  # 查看命令 run 的帮助
help info                 # 列出查看程序运行状态相关的命令
help info line            # 列出具体的一个运行状态命令的帮助
help show                 # 列出 GDB 状态相关的命令
help show commands        # 列出 show 命令的帮助
断点 #
break main                # 对函数 main 设置一个断点,简写 b main
break 101                 # 对当前文件源代码的行号设置断点,简写 b 101
break basic.c:101         # 对源代码和行号设置断点
break basic.c:foo         # 对源代码和函数名设置断点
break *0x00400448         # 对内存地址 0x00400448 设置断点,地址前需要使用 *

watch {expr}              # 写 expr 时触发断点
rwatch {expr}             # 读 expr 时触发断点
awatch {expr}             # 读写 expr 时触发断点

info breakpoints          # 列出当前的所有断点,可简写为 info break 或 i b
info watch                # 列出所有 watch 点;

\# clear 和 delete:删除断点或监视,但 delete 通过断点编号,而 clear 基于位置(函数、行号)
clear                     # 删除在当前行的断点
clear function            # 删除函数断点
clear line                # 删除行号断点
clear basic.c:101         # 删除文件名和行号的断点
clear basic.c:main        # 删除文件名和函数名的断点
clear *0x00400448         # 删除内存地址的断点

delete # 删除全部断点
delete 1 # 删除 1 号断点
disable # 关闭全部断点,但是不删除
disable 1 # 关闭 1 号断点

enable # 启用全部断点
enable 1 # 启用 1 号断点
运行程序 #
run  [paramiters]         # 带参数执行程序
run < file                # 以某文件为标准输入运行程序
run < <(cmd)              # 以某命令的输出作为标准输入运行程序
run <<< $(cmd)            # 以某命令的输出作为标准输入运行程序
set args {args} ...       # 设置执行程序的参数
show args                 # 显示执行程序的运行参数

attach {PID}              # 调试进程,需要使用 file 指定 binary,或者需要位于进程的代码目录。
detach                    # 断开进程链接

kill                      # 杀死当前运行的函数
CTRL+C                    # 发送 SIGINT 信号,中止当前运行的程序
调试 #
next                      # 单步执行,不进入函数
step                      # 单步执行,进入函数
continue                  # 全速执行,直到遇到断点或函数结束
finish                    # 运行到当前函数结束(Step Out)
advance location	        # Advance to a location, line number, or file (e.g. "somefunction", "5", or "hello.c:23")
until
查看源码 #
list                      # 显示当前执行位置的代码
list 101                  # 显示第 101 行周围 10 行代码
list 1,10                 # 显示 1 到 10 行代码
list main                 # 显示函数周围代码
list basic.c:main         # 显示另外一个源代码文件的函数周围代码
list *0x22e4              # 显示特定地址的代码

search {regexpr}          # 向前进行正则搜索
reverse-search {regexp}   # 向后进行正则搜索

dir {dirname}             # 增加源代码搜索路径,适用于 PID 调试
dir                       # 复位源代码搜索路径(清空)
show directories          # 显示源代码路径
cd dir                    # 切换当前目录
pwd                       # 显示当前目录

info functions {regexp}   # 打印函数名称
info variables {regexp}   # 打印全局变量名称
查看栈帧 #
bt    [full][frame-number] # 打印函数的堆栈,可以查看出错前函数的调用情况和临时变量值
where  [full][frame-numbber] # 同上
frame  [frame-number] # 显示bt列出的帧序号所对应的详细信息
up                        # 向上移动栈帧(向着 main 函数)
down                      # 向下移动栈帧(远离 main 函数)
info locals               # 打印帧内的临时变量
info args                 # 打印函数的参数
打印信息 #
set var p = malloc(sizeof(int))  # 变量赋值

print p                   # 显示变量值
print *p                  # 显示变量值
print $var-number         # 显示变量值
print /x &main            # 打印函数地址
printf "...",var1,var2    # 格式化输出变量值
print array[i]@count      # 打印数组范围
print 'basic.c'::gx       # 打印某源代码里的全局变量

x /nfu {address}          # 打印内存数据,n是多少个,f是格式,u是单位大小
x *0x11223344             # 显示给定地址的内存数据
x /10xb *0x11223344       # 按十六进制打印内存地址 0x11223344 处的十个字节

display {expression}      # 在单步指令后显示表达式的值,如 display i;
undisplay                 # 删除单步后对某些值的监控
info display              # 显示监视的表达式

info registers            # 打印普通寄存器
info all-registers        # 打印所有寄存器
print /x $pc              # 打印单个寄存器
汇编调试 #
disassemble [function-name]|[address] # 反汇编
stepi                                 # 单步执行汇编
nexti                                 # 单步执行汇编
info line 22                          # 打印行号为 22 的内存地址信息
info line *0x2c4e                     # 打印给定内存地址对应的源代码和行号信息
display/i $pc                         # 监控寄存器(每条单步完以后会自动打印值)
线程调试 #
info threads              # 查看当前线程和 id
thread {id}               # 切换当前调试线程为指定 id 的线程
break {line} thread all   # 所有线程在指定行号处设置断点
thread apply {id..} cmd   # 指定多个线程共同执行 gdb 命令
thread apply all cmd      # 所有线程共同执行 gdb 命令
set schedule-locking ?    # 调试一个线程时,其他线程是否执行,off|on|step
set non-stop on/off       # 调试一个线程时,其他线程是否运行
set pagination on/off     # 调试一个线程时,分页是否停止
set target-async on/off   # 同步或者异步调试,是否等待线程中止的信息
进程调试 #
info inferiors                       # 查看当前进程和 id
inferior {id}                        # 切换某个进程
kill inferior {id...}                # 杀死某个进程
set detach-on-fork on/off            # 设置当进程调用fork时gdb是否同时调试父子进程
set follow-fork-mode parent/child    # 设置当进程调用fork时是否进入子进程
远程调试 #
在远程目标机器上启动 gdbserver, 监听 1234 端口:
$ gdbserver :1234 ./your_program
在本地机器上启动 gdb 并加载可执行文件(用于提取符号表、DWARF 调试信息等),然后链接到远程 gdbserver:
gdb ./your_program
# 连接到目标机器上的 GDB 服务器:
(gdb) target remote 192.168.1.100:1234
连接成功后,就像本地调试一样使用 GDB 的各种命令来调试程序。例如,设置断点、单步执行、查看变量等。
另外,qemu 也支持 gdb 调试,常用来调试内核。
在启动 QEMU 时,可以使用 -s 和 -S 选项来启用 GDB 调试:
-s:在 TCP 端口 1234 上启动一个 GDB 服务器。-S:在启动时暂停 CPU,等待 GDB 连接。
例如,启动一个 x86_64 的 Linux 内核镜像:
qemu-system-x86_64 -kernel bzImage -append "root=/dev/sda" -hda rootfs.img -s -S
然后,本地启动 gdb,连接到 Qemu 提供的 gdbserver 进行调试:
gdb vmlinux
(gdb) target remote localhost:1234
其它 #
help [command]            # 查看命令帮助
quit                      # 退出 gdb
<return>                  # 直接按回车执行上一条指令
shell {command} [args]    # 执行 shell 命令
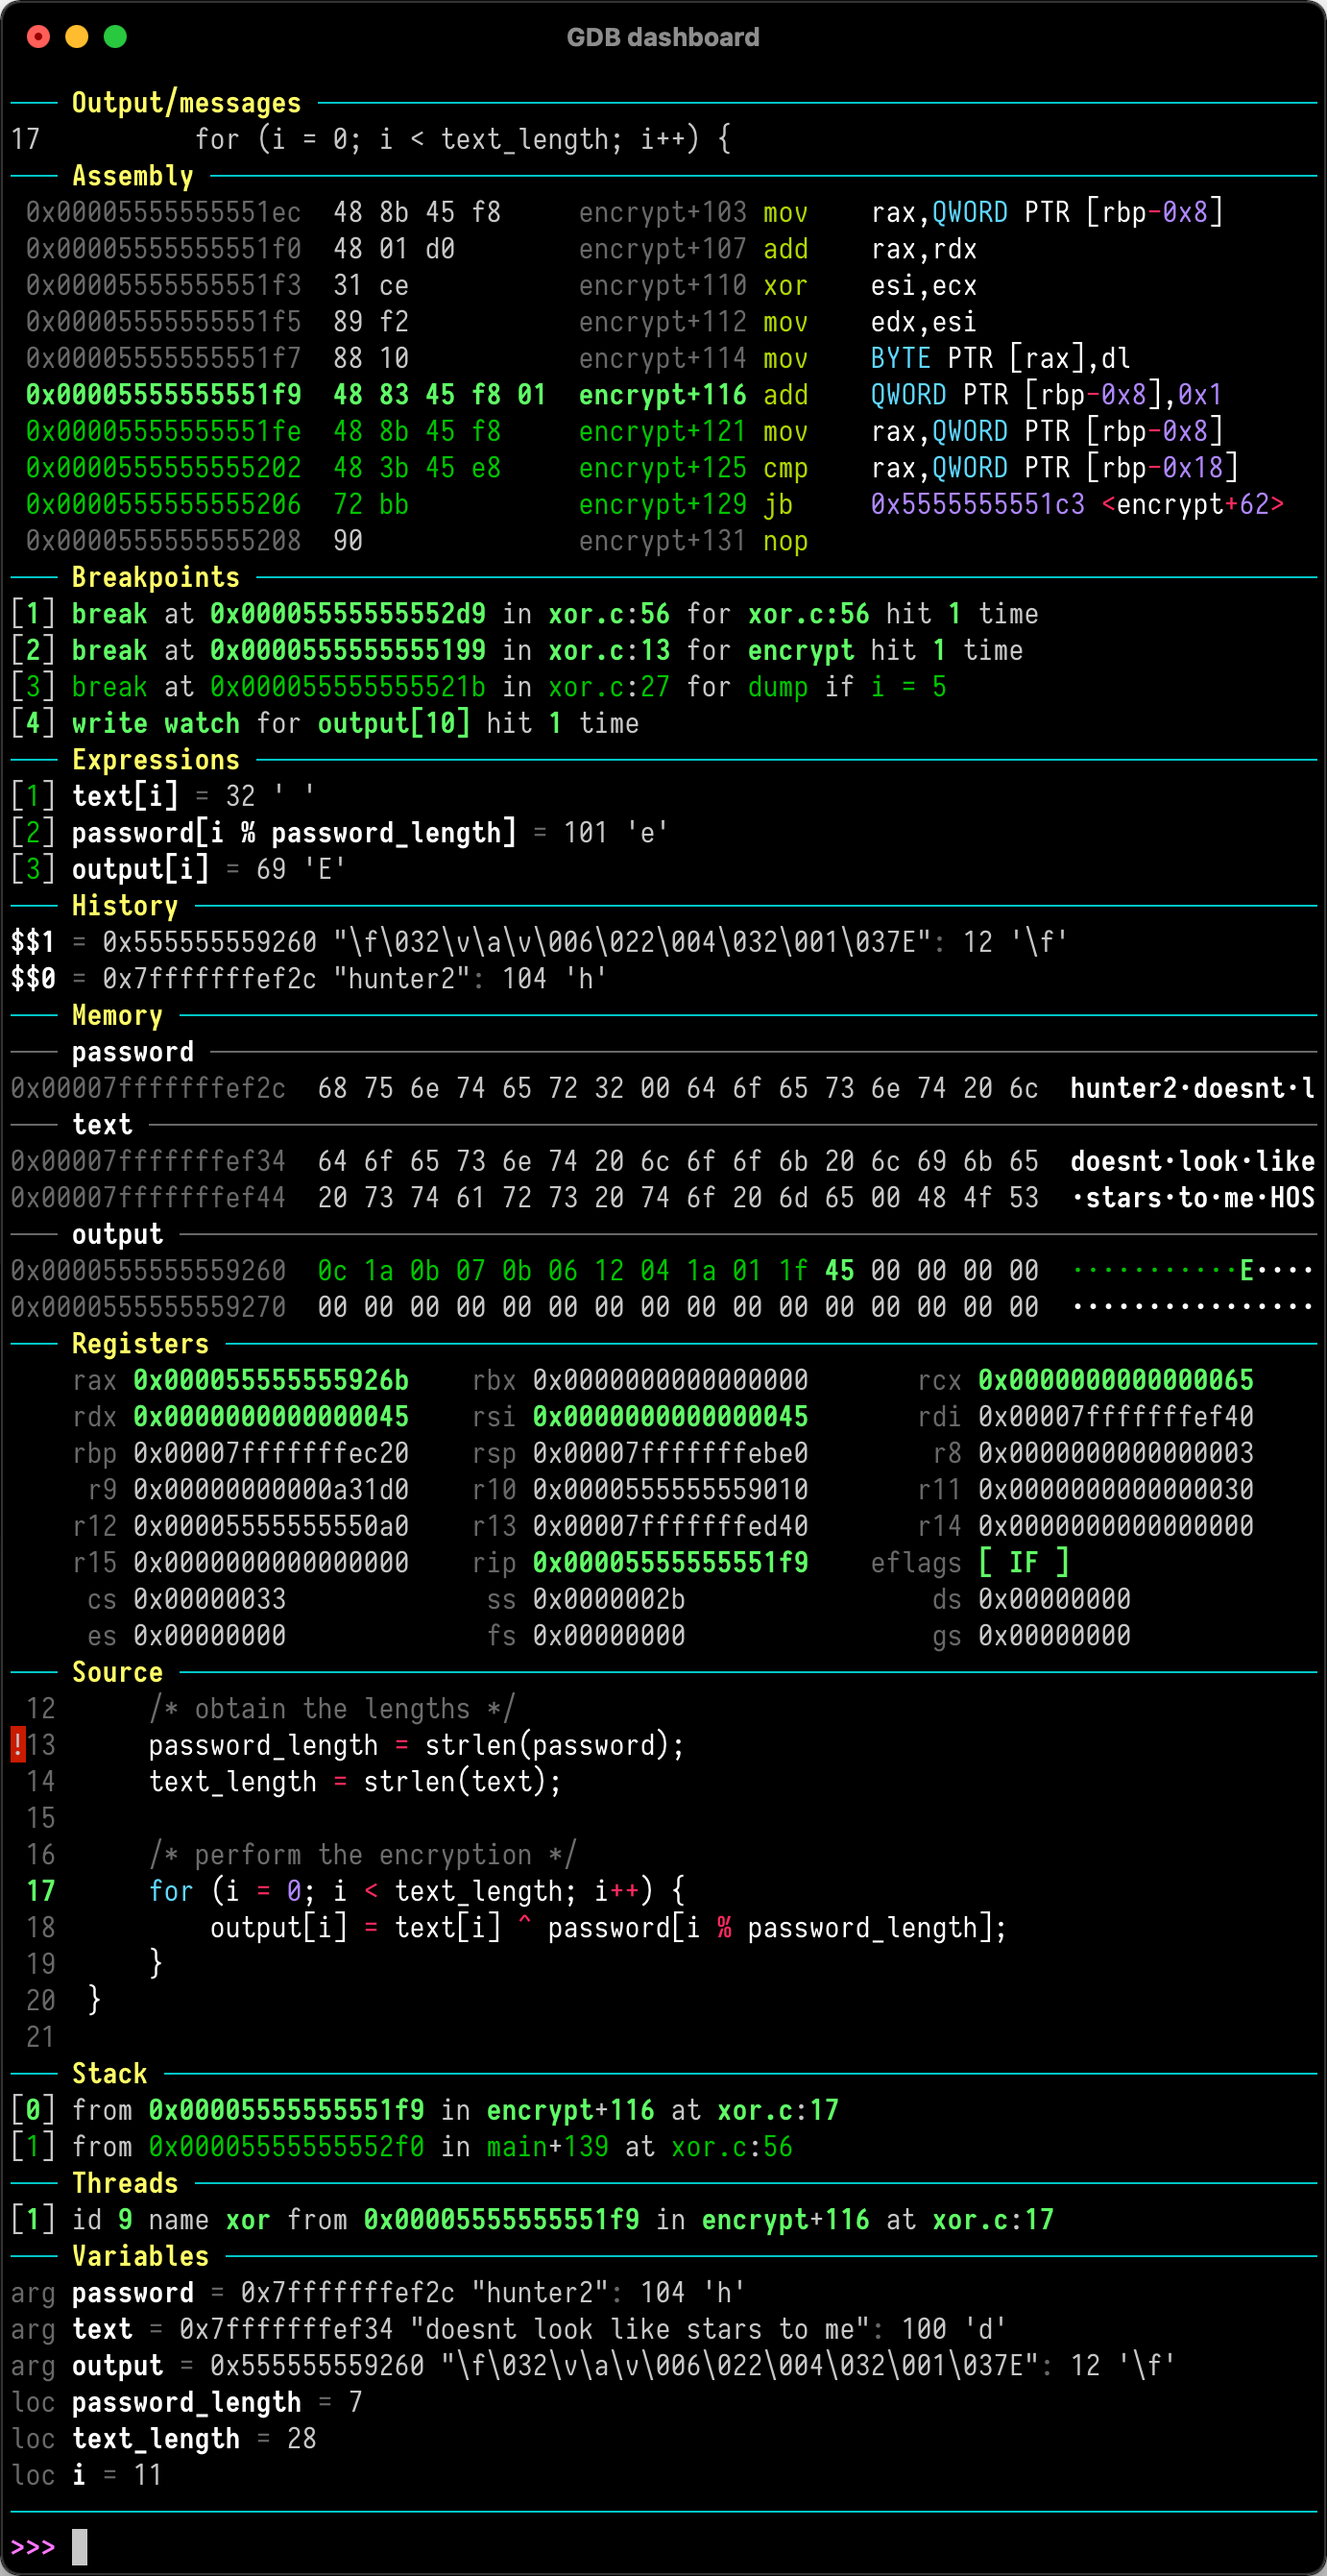
gdb 前端: https://github.com/cyrus-and/gdb-dashboard
C/Go 反汇编 #
gdb, objdump, go tool objdump 都可以实现 不运行程序 的情况下反汇编。
gdb 反汇编函数 #
Go 函数名一般包括完整路径,如:git.com/my-agent/pkg/containers/docker.GetSandboxLabels
这里的 . 和 / 和 - 都不是标准的 C 变量名称标识符,所以 gdb 不支持直接使用。
解决办法:
- info functions
支持使用正则匹配函数名。 - 使用字符串 ‘
’,如 - x/i ‘git.com/my-agent/pkg/containers/docker.GetSandboxLabels’
- print ‘git.com/my-agent/pkg/containers/docker.GetSandboxLabels’
- disassemble ‘git.com/my-agent/pkg/containers/docker.GetSandboxLabels’
# gdb /tmp/my-agent
For help, type "help".
Type "apropos word" to search for commands related to "word"...
Reading symbols from /tmp/my-agent...done.

# 显示所有函数
(gdb) info functions

# 显示匹配指定正则的函数
# info functions <Regexp> 支持正则表达式匹配函数名
(gdb) info functions GetSandboxLabels
All functions matching regular expression "GetSandboxLabels":
File /Users/alizj/go/src/git.com/my-agent/pkg/containers/docker/docker.go:
179:	void git.com/my-agent/pkg/containers/docker.GetSandboxLabels(string, map[string]string);

(gdb) info functions git.com/my-agent/pkg/containers/docker.GetSandboxLabels
All functions matching regular expression "git.com/my-agent/pkg/containers/docker.GetSandboxLabels":
File /Users/alizj/go/src/git.com/my-agent/pkg/containers/docker/docker.go:
179:	void git.com/my-agent/pkg/containers/docker.GetSandboxLabels(string, map[string]string);

# 显示函数地址,需要使用单引号括住函数名完整路径
(gdb) x/i 'git.com/my-agent/pkg/containers/docker.GetSandboxLabels'
   0x1535ce0 <git.com/my-agent/pkg/containers/docker.GetSandboxLabels>:	lea    -0x68(%rsp),%r12

(gdb) print 'git.com/my-agent/pkg/containers/docker.GetSandboxLabels'
   $1 = {void (string, map[string]string)} 0x1535ce0 <git.com/my-agent/pkg/containers/docker.GetSandboxLabels>

(gdb) info address 'git.com/my-agent/pkg/containers/docker.GetSandboxLabels'
   No symbol "'git.com/my-agent/pkg/containers/docker.GetSandboxLabels'" in current context.


# 反汇编函数
## 按函数地址反汇编
(gdb) disassemble 0x1535ce0
Dump of assembler code for function git.com/my-agent/pkg/containers/docker.GetSandboxLabels:
   0x0000000001535ce0 <+0>:	lea    -0x68(%rsp),%r12
   0x0000000001535ce5 <+5>:	cmp    0x10(%r14),%r12

## 如果函数名包含特殊字符,需要使用单引号括住
(gdb) disassemble git.com/my-agent/pkg/containers/docker.GetSandboxLabels
No symbol "gitlab" in current context.
## 按函数名反汇编
(gdb) disassemble 'git.com/my-agent/pkg/containers/docker.GetSandboxLabels'
Dump of assembler code for function git.com/my-agent/pkg/containers/docker.GetSandboxLabels:
   0x0000000001535ce0 <+0>:	lea    -0x68(%rsp),%r12
   0x0000000001535ce5 <+5>:	cmp    0x10(%r14),%r12
   0x0000000001535ce9 <+9>:	jbe    0x1535f84 <git.com/my-agent/pkg/containers/docker.GetSandboxLabels+676>
   0x0000000001535cef <+15>:	push   %rbp
   0x0000000001535cf0 <+16>:	mov    %rsp,%rbp
   0x0000000001535cf3 <+19>:	sub    $0xe0,%rsp
   0x0000000001535cfa <+26>:	mov    %rbx,0xf8(%rsp)
   0x0000000001535d02 <+34>:	mov    %rax,0xf0(%rsp)
   0x0000000001535d0a <+42>:	cmpq   $0x0,0x1d2571e(%rip)        # 0x325b430 <git.com/my-agent/pkg/containers/options.cache>
   0x0000000001535d12 <+50>:	jne    0x1535d4c <git.com/my-agent/pkg/containers/docker.GetSandboxLabels+108>
反汇编时可以加 /m 或 /s 来显示函数源码:
(gdb) disassemble /m 0x1535ce0
Dump of assembler code for function git.com/my-agent/pkg/containers/docker.GetSandboxLabels:
179	/Users/alizj/go/src/git.com/my-agent/pkg/containers/docker/docker.go: No such file or directory.
   0x0000000001535ce0 <+0>:	lea    -0x68(%rsp),%r12
   0x0000000001535ce5 <+5>:	cmp    0x10(%r14),%r12
   0x0000000001535ce9 <+9>:	jbe    0x1535f84 <git.com/my-agent/pkg/containers/docker.GetSandboxLabels+676>
   0x0000000001535cef <+15>:	push   %rbp
go 反汇编例子 #
To figure out go calling conventions, we could compose some simple functions, then look at their generated assembly code. For example, the following simple function:
func fewArgsTest(a1, a2, a3, a4 uint64) (uint64, uint64, uint64, uint64) {
	return a1+0x11, a2+0x22, a3+0x33, a4+0x44
}
We can disassemble this function (at 0x0000000000459d20):
$ gdb -batch -ex 'file ./example' -ex 'disassemble 0x0000000000459d20'
Dump of assembler code for function main.fewArgsTest:
   0x0000000000459d20 <+0>:     add    $0x11,%rax
   0x0000000000459d24 <+4>:     add    $0x22,%rbx
   0x0000000000459d28 <+8>:     add    $0x33,%rcx
   0x0000000000459d2c <+12>:    add    $0x44,%rdi
   0x0000000000459d30 <+16>:    ret
End of assembler dump.
It’s easy to see that the four arguments are passed in the registers rax, rbx, rcx, and rdi. This example code has more such functions. The following are some results for Go 1.19.
下面是演示代码 main.go,我们的目标是通过 bpftrace 分析 concat 方法的输入输出: https://cloud.tencent.com/developer/article/1918230
package main

func main() {
	println(concat("ab", "cd"))
}

func concat(a, b string) string {
	return a + b
}
让我们通过 gdb 来看看 go1.17 中字符串参数是怎么传递的:
shell> go build -gcflags="-l" ./main.go
shell> gdb ./main
(gdb) # 设置断点
(gdb) b main.concat
(gdb) # 运行
(gdb) r
(gdb) # 查看参数
(gdb) i args
x = 0x461513 "ab"
y = 0x461515 "cd"
(gdb) # 查看寄存器
(gdb) i r
rax 0x461513 4592915
rbx 0x2 2
rcx 0x461515 4592917
rdi 0x2 2
(gdb) # 检查地址 0x461513
(gdb) x/2cb 0x461513
0x461513: 97 'a' 98 'b'
(gdb) # 检查地址 0x461515
(gdb) x/2cb 0x461515
0x461515: 99 'c' 100 'd'
(gdb) # 查看寄存器
(gdb) i r
rax 0xc00001a0e0 824633827552
rbx 0x4 4
(gdb) # 检查地址 0xc00001a0e0
(gdb) x/4cb 0xc00001a0e0
0xc00001a0e0: 97 'a' 98 'b' 99 'c' 100 'd'
如上可见:当我们给 main.sum 方法传递两个字符串参数的时候,实际上是占用 4 个寄存器,每个字符串参数占用两个寄存器,分别是地址和长度,正好贴合字符串的数据结构:
type StringHeader struct {
	Data uintptr
	Len  int
}
了解了相关知识之后,我们就可以通过如下 bpftrace 命令来监控 sum 的输入输出了:
shell> bpftrace -e '
    uprobe:./main:main.concat {
        printf("a: %s b: %s\n",
            str(reg("ax"), reg("bx")),
            str(reg("cx"), reg("di"))
        )
    }
    uretprobe:./main:main.concat {
        printf("retval: %s\n", str(reg("ax"), reg("bx")))
        // printf("retval: %s\n", str(retval))
    }
'
a: ab b: cd
retval: abcd
以上,我们介绍了当参数和返回值是整形或字符串时,如何用 bpftrace 分析 golang 程序,如果类型更复杂的话,比如说是一个 struct,那么原理也是类似的,篇幅所限,本文就不再赘述了,有兴趣的读者可以参考文章后面的相关链接。
go 反汇编例子 2 #
通过 bpftrace 分析 golang 方法的参数和返回值
下面是演示代码 main.go,我们的目标是通过 bpftrace 分析 sum 方法的输入输出:
package main
func main() { println(sum(11, 22)) }
func sum(a, b int) int { return a + b }
在编译的时候,记得关闭内联,否则一旦 sum 被内联了,eBPF 就没法加探针了:
shell> go build -gcflags="-l" ./main.go shell> objdump -t ./main | grep -w sum 000000000045dd60 g F .text 0000000000000033 main.sum
准备工作做好之后,我们就可以通过如下 bpftrace 命令来监控 sum 的输入输出了:
shell> bpftrace -e ' uprobe:./main:main.sum {printf(“a: %d b: %d\n”, sarg0, sarg1)} uretprobe:./main:main.sum {printf(“retval: %d\n”, retval)} ' a: 11 b: 22 retval: 33
不过测试发现,如上 bpftrace 命令仅在 go1.17 之前的版本工作正常,在 go1.17 之后的版本,sargx 变量取不到数据,这是因为从 go.1.17 开始,参数不再保存在栈里,而是保存在寄存器中,关于这一点在 Go internal ABI specification 中有详细的描述:
amd64 architecture The amd64 architecture uses the following sequence of 9 registers for integer arguments and results: RAX, RBX, RCX, RDI, RSI, R8, R9, R10, R11
让我们通过 gdb 来验证这一点:
shell> gdb ./main (gdb) # 设置断点 (gdb) b main.sum (gdb) # 运行 (gdb) r (gdb) # 查看寄存器 (gdb) i r rax 0xb 11 rbx 0x16 22
如上可见:main.sum 的第一个参数保存在 rax 寄存器,第二个参数保存在 rbx 寄存器,和 Go internal ABI specification 中的描述一致。
搞清楚这些之后,我们就知道在 go1.17 以后的版本,如何用 bpftrace 监控输入输出了:
shell> bpftrace -e ' uprobe:./main:main.sum {printf(“a: %d b: %d\n”, reg(“ax”), reg(“bx”))} uretprobe:./main:main.sum {printf(“retval: %d\n”, retval)} ' a: 11 b: 22 retval: 33
说到这,细心的读者可能已经发现:我们一直在讨论整形,如果是字符串该怎么办?我们不妨构造一个字符串的例子再来测试一下,本次测试是在 go1.17 下进行的:
下面是演示代码 main.go,我们的目标是通过 bpftrace 分析 concat 方法的输入输出:
package main
func main() { println(concat(“ab”, “cd”)) }
func concat(a, b string) string { return a + b }
让我们通过 gdb 来看看 go1.17 中字符串参数是怎么传递的:
shell> go build -gcflags="-l" ./main.go shell> gdb ./main (gdb) # 设置断点 (gdb) b main.concat (gdb) # 运行 (gdb) r (gdb) # 查看参数 (gdb) i args x = 0x461513 “ab” y = 0x461515 “cd” (gdb) # 查看寄存器 (gdb) i r rax 0x461513 4592915 rbx 0x2 2 rcx 0x461515 4592917 rdi 0x2 2 (gdb) # 检查地址 0x461513 (gdb) x/2cb 0x461513 0x461513: 97 ‘a’ 98 ‘b’ (gdb) # 检查地址 0x461515 (gdb) x/2cb 0x461515 0x461515: 99 ‘c’ 100 ’d’ (gdb) # 查看寄存器 (gdb) i r rax 0xc00001a0e0 824633827552 rbx 0x4 4 (gdb) # 检查地址 0xc00001a0e0 (gdb) x/4cb 0xc00001a0e0 0xc00001a0e0: 97 ‘a’ 98 ‘b’ 99 ‘c’ 100 ’d’
如上可见:当我们给 main.sum 方法传递两个字符串参数的时候,实际上是占用 4 个寄存器,每个字符串参数占用两个寄存器,分别是地址和长度,正好贴合字符串的数据结构:
type StringHeader struct { Data uintptr Len int }
了解了相关知识之后,我们就可以通过如下 bpftrace 命令来监控 sum 的输入输出了:
shell> bpftrace -e ' uprobe:./main:main.concat { printf(“a: %s b: %s\n”, str(reg(“ax”), reg(“bx”)), str(reg(“cx”), reg(“di”)) ) } uretprobe:./main:main.concat { printf(“retval: %s\n”, str(reg(“ax”), reg(“bx”))) // printf(“retval: %s\n”, str(retval)) } ' a: ab b: cd retval: abcd
以上,我们介绍了当参数和返回值是整形或字符串时,如何用 bpftrace 分析 golang 程序,如果类型更复杂的话,比如说是一个 struct,那么原理也是类似的,篇幅所限,本文就不再赘述了,有兴趣的读者可以参考文章后面的相关链接。
go 反汇编例子 3 #
以如下 Go 函数为例:
- go string 占用两个 64 bits
func GetSandboxLabels(sanboxId string) map[string]string {
	// 1.先从 cache 中查.
	cCache := options.GetCache()
	if cCache != nil {
		if container := cCache.Get(sanboxId); container != nil {
			return container.Value().Labels
		}
	}

	// 2.如果 cache 中没有则调用接口查.
	inspect, err := dClient.ContainerInspect(context.Background(), sanboxId)
	if err != nil {
		log.V(1).Infof("Error inspecting container %s: %v\n", sanboxId, err)
		return map[string]string{}
	}
	return inspect.Config.Labels
}

#/tmp/bpftrace4 -lv 'uprobe:/tmp/my-agent:*GetSandboxLabels*'
/tmp/bpftrace4: stat /static-python: No such file or directory
uprobe:/tmp/my-agent:git.com/my-agent/pkg/containers/docker.GetSandboxLabels
    struct string sanboxId
    map[string]string ~r0

(gdb) b git.com/my-agent/pkg/containers/docker.GetSandboxLabels
Breakpoint 1 at 0x1535ce0: file /Users/alizj/go/src/git.com/my-agent/pkg/containers/docker/docker.go, line 179.
(gdb) disas 0x1535ce0
Dump of assembler code for function git.com/my-agent/pkg/containers/docker.GetSandboxLabels:
   0x0000000001535ce0 <+0>:	lea    -0x68(%rsp),%r12
   0x0000000001535ce5 <+5>:	cmp    0x10(%r14),%r12
   0x0000000001535ce9 <+9>:	jbe    0x1535f84 <git.com/my-agent/pkg/containers/docker.GetSandboxLabels+676>
   0x0000000001535cef <+15>:	push   %rbp
   0x0000000001535cf0 <+16>:	mov    %rsp,%rbp
   0x0000000001535cf3 <+19>:	sub    $0xe0,%rsp
   0x0000000001535cfa <+26>:	mov    %rbx,0xf8(%rsp)
   0x0000000001535d02 <+34>:	mov    %rax,0xf0(%rsp)
   0x0000000001535d0a <+42>:	cmpq   $0x0,0x1d2571e(%rip)        # 0x325b430 <git.com/my-agent/pkg/containers/options.cache>
   0x0000000001535d12 <+50>:	jne    0x1535d4c <git.com/my-agent/pkg/containers/docker.GetSandboxLabels+108>
   0x0000000001535d14 <+52>:	callq  0x101cfc0 <git.com/my-agent/pkg/containers/options.newCache>
   0x0000000001535d19 <+57>:	cmpl   $0x0,0x2294ca0(%rip)        # 0x37ca9c0 <runtime.writeBarrier>
   0x0000000001535d20 <+64>:	je     0x1535d35 <git.com/my-agent/pkg/containers/docker.GetSandboxLabels+85>
   0x0000000001535d22 <+66>:	callq  0x471140 <runtime.gcWriteBarrier2>
   0x0000000001535d27 <+71>:	mov    %rax,(%r11)
   0x0000000001535d2a <+74>:	mov    0x1d256ff(%rip),%rdx        # 0x325b430 <git.com/my-agent/pkg/containers/options.cache>
   0x0000000001535d31 <+81>:	mov    %rdx,0x8(%r11)
   0x0000000001535d35 <+85>:	mov    %rax,0x1d256f4(%rip)        # 0x325b430 <git.com/my-agent/pkg/containers/options.cache>
   0x0000000001535d3c <+92>:	mov    0xf0(%rsp),%rax
   0x0000000001535d44 <+100>:	mov    0xf8(%rsp),%rbx
   0x0000000001535d4c <+108>:	mov    0x1d256dd(%rip),%rdx        # 0x325b430 <git.com/my-agent/pkg/containers/options.cache>
让我分析这段代码的对应关系:
- 函数设置和参数处理
lea    -0x68(%rsp),%r12   # 设置栈指针
cmp    0x10(%r14),%r12    # 栈空间检查
jbe    0x1535f84          # 栈溢出处理跳转
push   %rbp               # 保存旧的栈基址
mov    %rsp,%rbp          # 设置新的栈基址
sub    $0xe0,%rsp        # 分配 224 字节栈空间
- 保存寄存器和参数
mov    %rbx,0xf8(%rsp)    # 保存 rbx
mov    %rax,0xf0(%rsp)    # 保存 rax (可能包含 sandboxId 参数)
- 检查缓存是否存在(对应代码中的 options.GetCache())
cmpq   $0x0,0x1d2571e(%rip)  # 检查 options.cache 是否为 nil
jne    0x1535d4c             # 如果不为 nil,跳转
- 缓存不存在时的处理
callq  0x101cfc0            # 调用 options.newCache()
cmpl   $0x0,0x2294ca0(%rip) # 检查写屏障
je     0x1535d35            # 如果写屏障禁用,跳转
callq  0x471140             # 调用 runtime.gcWriteBarrier2
- 更新缓存
mov    %rax,(%r11)         # 存储新缓存
mov    0x1d256ff(%rip),%rdx # 加载旧缓存
mov    %rdx,0x8(%r11)      # 更新缓存
mov    %rax,0x1d256f4(%rip) # 保存新缓存
这段汇编对应了原始代码中的:
- 获取缓存实例
options.GetCache() - 检查缓存是否为空
if cCache != nil - 如果缓存不存在,创建新的缓存
特别注意:
- Go 的垃圾回收写屏障机制在汇编中有体现
- 缓存操作涉及到全局变量的访问和更新
- 这只是函数的开始部分,后续还应该有:
- 从缓存中获取容器信息
- 调用 ContainerInspect
- 错误处理
- 返回标签映射
这段代码展示了 Go 在处理:
- 全局变量访问
- 内存管理和垃圾回收
- 条件分支
- 函数调用约定 等方面的底层实现细节。
前面的 GetSandboxLabels 是哪种传参模式?
让我分析一下 GetSandboxLabels 函数的传参模式。从之前的反汇编代码看:
Dump of assembler code for function GetSandboxLabels:
   0x0000000001535ce0 <+0>:	lea    -0x68(%rsp),%r12
   0x0000000001535ce5 <+5>:	cmp    0x10(%r14),%r12
   0x0000000001535ce9 <+9>:	jbe    0x1535f84
   0x0000000001535cef <+15>:	push   %rbp
   0x0000000001535cf0 <+16>:	mov    %rsp,%rbp
   0x0000000001535cf3 <+19>:	sub    $0xe0,%rsp
   0x0000000001535cfa <+26>:	mov    %rbx,0xf8(%rsp)
   0x0000000001535d02 <+34>:	mov    %rax,0xf0(%rsp)    # 保存 rax 到栈上
结合原始代码:func GetSandboxLabels(sanboxId string) map[string]string
这是寄存器传参模式,原因如下:
-
输入参数 sandboxId 是通过 RAX 寄存器传入的
- 从
mov %rax,0xf0(%rsp)可以看出,RAX 寄存器的值被保存到栈上
- 从
-
函数使用了 Go 的寄存器 ABI(Application Binary Interface)
- Go 1.17 之后的寄存器传参约定中,第一个参数通常使用 RAX 寄存器
- string 类型正好适合通过寄存器传递
-
函数开头没有从栈上加载参数的操作,而是将寄存器中的值保存到栈上
- 这是寄存器传参的典型特征
- 保存到栈上是为了后续使用或在函数调用时保护参数值
这说明该函数使用的是现代 Go 编译器的寄存器传参模式,而不是传统的栈传参模式。
Go 编译&调试 #
go build 生成的二进制默认包含符号表和调试信息,除非使用链接参数 -ldflags="-s -w" 来去除它们:
- -s: 去掉符号表和调试信息(Omit the symbol table and debug information.)
- -w:去掉 DWARF 符号表调试信息;(Omit the DWARF symbol table.)
查看帮助:go doc cmd/link 或 go tool link
注:go 自身的 link 使用 -ldflags 参数,而 -extldflags "-static" 是 go link 调用的外部链接器,如 gnu ld 的参数。
go run 默认使用 --ldflags '-s -w', 也即删除了 symbol table(-s) 和 DWARF debug info(-w),不能用于调试。
为了调试 go 程序,需要使用命令 go build -gcflags=all="-N -l",避免影响调试。
- -N:关闭代码优化;
- -l:关闭 inlining 内联函数;
查看 go 符号表: go tool nm ./app
go 源码级调试工具:推荐 go-delve/delve,它也是 vs-code 等 IDE 使用的 go 调试器。
不推荐 gdb 调试 go 程序:
- gdb 对 Go 的调试支持是通过一个 python 脚本文件 src/runtime/runtime-gdb.py 扩展的,功能有限;
- gdb 对 go 数据类型支持的不友好,只能做到最基本的变量打印,却理解不了一些特殊类型,比如 channel,map,slice 等,例如不能打印 go map 具体的内容,只能够打印 map 底层结构;
- gdb 不支持 goroutine,因为这是用户态的调度单位,gdb 只能理解线程,所以只能通过 python 脚本的扩展,把协程结构按照链表输出;
Rust 编译&调试 #
cargo 默认包含 4 个 profiles:dev、release、test 和 bench:
cargo build # 默认是 --debug
cargo build --release
cargo build 默认使用 dev profile, 也可以使用 --debug 参数来指定:cargo install --debug, cargo build --debug
profile dev 默认参数如下:
[profile.dev]
opt-level = 0  # 不开启优化,这样源码反汇编的更准确
debug = true   # 包含符号表和 DWARF 格式的 .debug_XX 调试符号表
split-debuginfo = '...'  # 平台相关
strip = "none" # 不删除符号表和调试符号表,可选值:"debuginfo","symbols", "none"
debug-assertions = true
overflow-checks = true
lto = false
panic = 'unwind'
incremental = true
codegen-units = 256
rpath = false
cargo install 默认使用 --release,也可以明确指定改参数 cargo build --release 。
profile release 默认参数如下:
[profile.release]
opt-level = 3  # 开启了代码优化,反汇编不准确
debug = false  # 不包含符号表和 DWARF 信息
split-debuginfo = '...'  # Platform-specific.
strip = "none"
debug-assertions = false
overflow-checks = false
lto = false
panic = 'unwind'
incremental = false
codegen-units = 16
rpath = false
总结:
cargo build或cargo install --dev默认使用 dev profile,未开启优化,结果 ELF 文件中包含符号表和调试符号表;cargo install或cargo build --release使用 release profile,开启了优化,也删除了符号表和调试符号表,不适合做调试;
Rust toolchain 自带 rust-gdb、rust-gdbgui 和 rust-lldb 调试器。
- RustRover IDE 默认使用
lldb对 Rust 进行调试:https://www.jetbrains.com/help/rust/rust-switch-debuggers-and-renderers.html - 绝大部分 Rust 开发者也是用
lldb进行调试:https://blog.rust-lang.org/2024/02/19/2023-Rust-Annual-Survey-2023-results.html